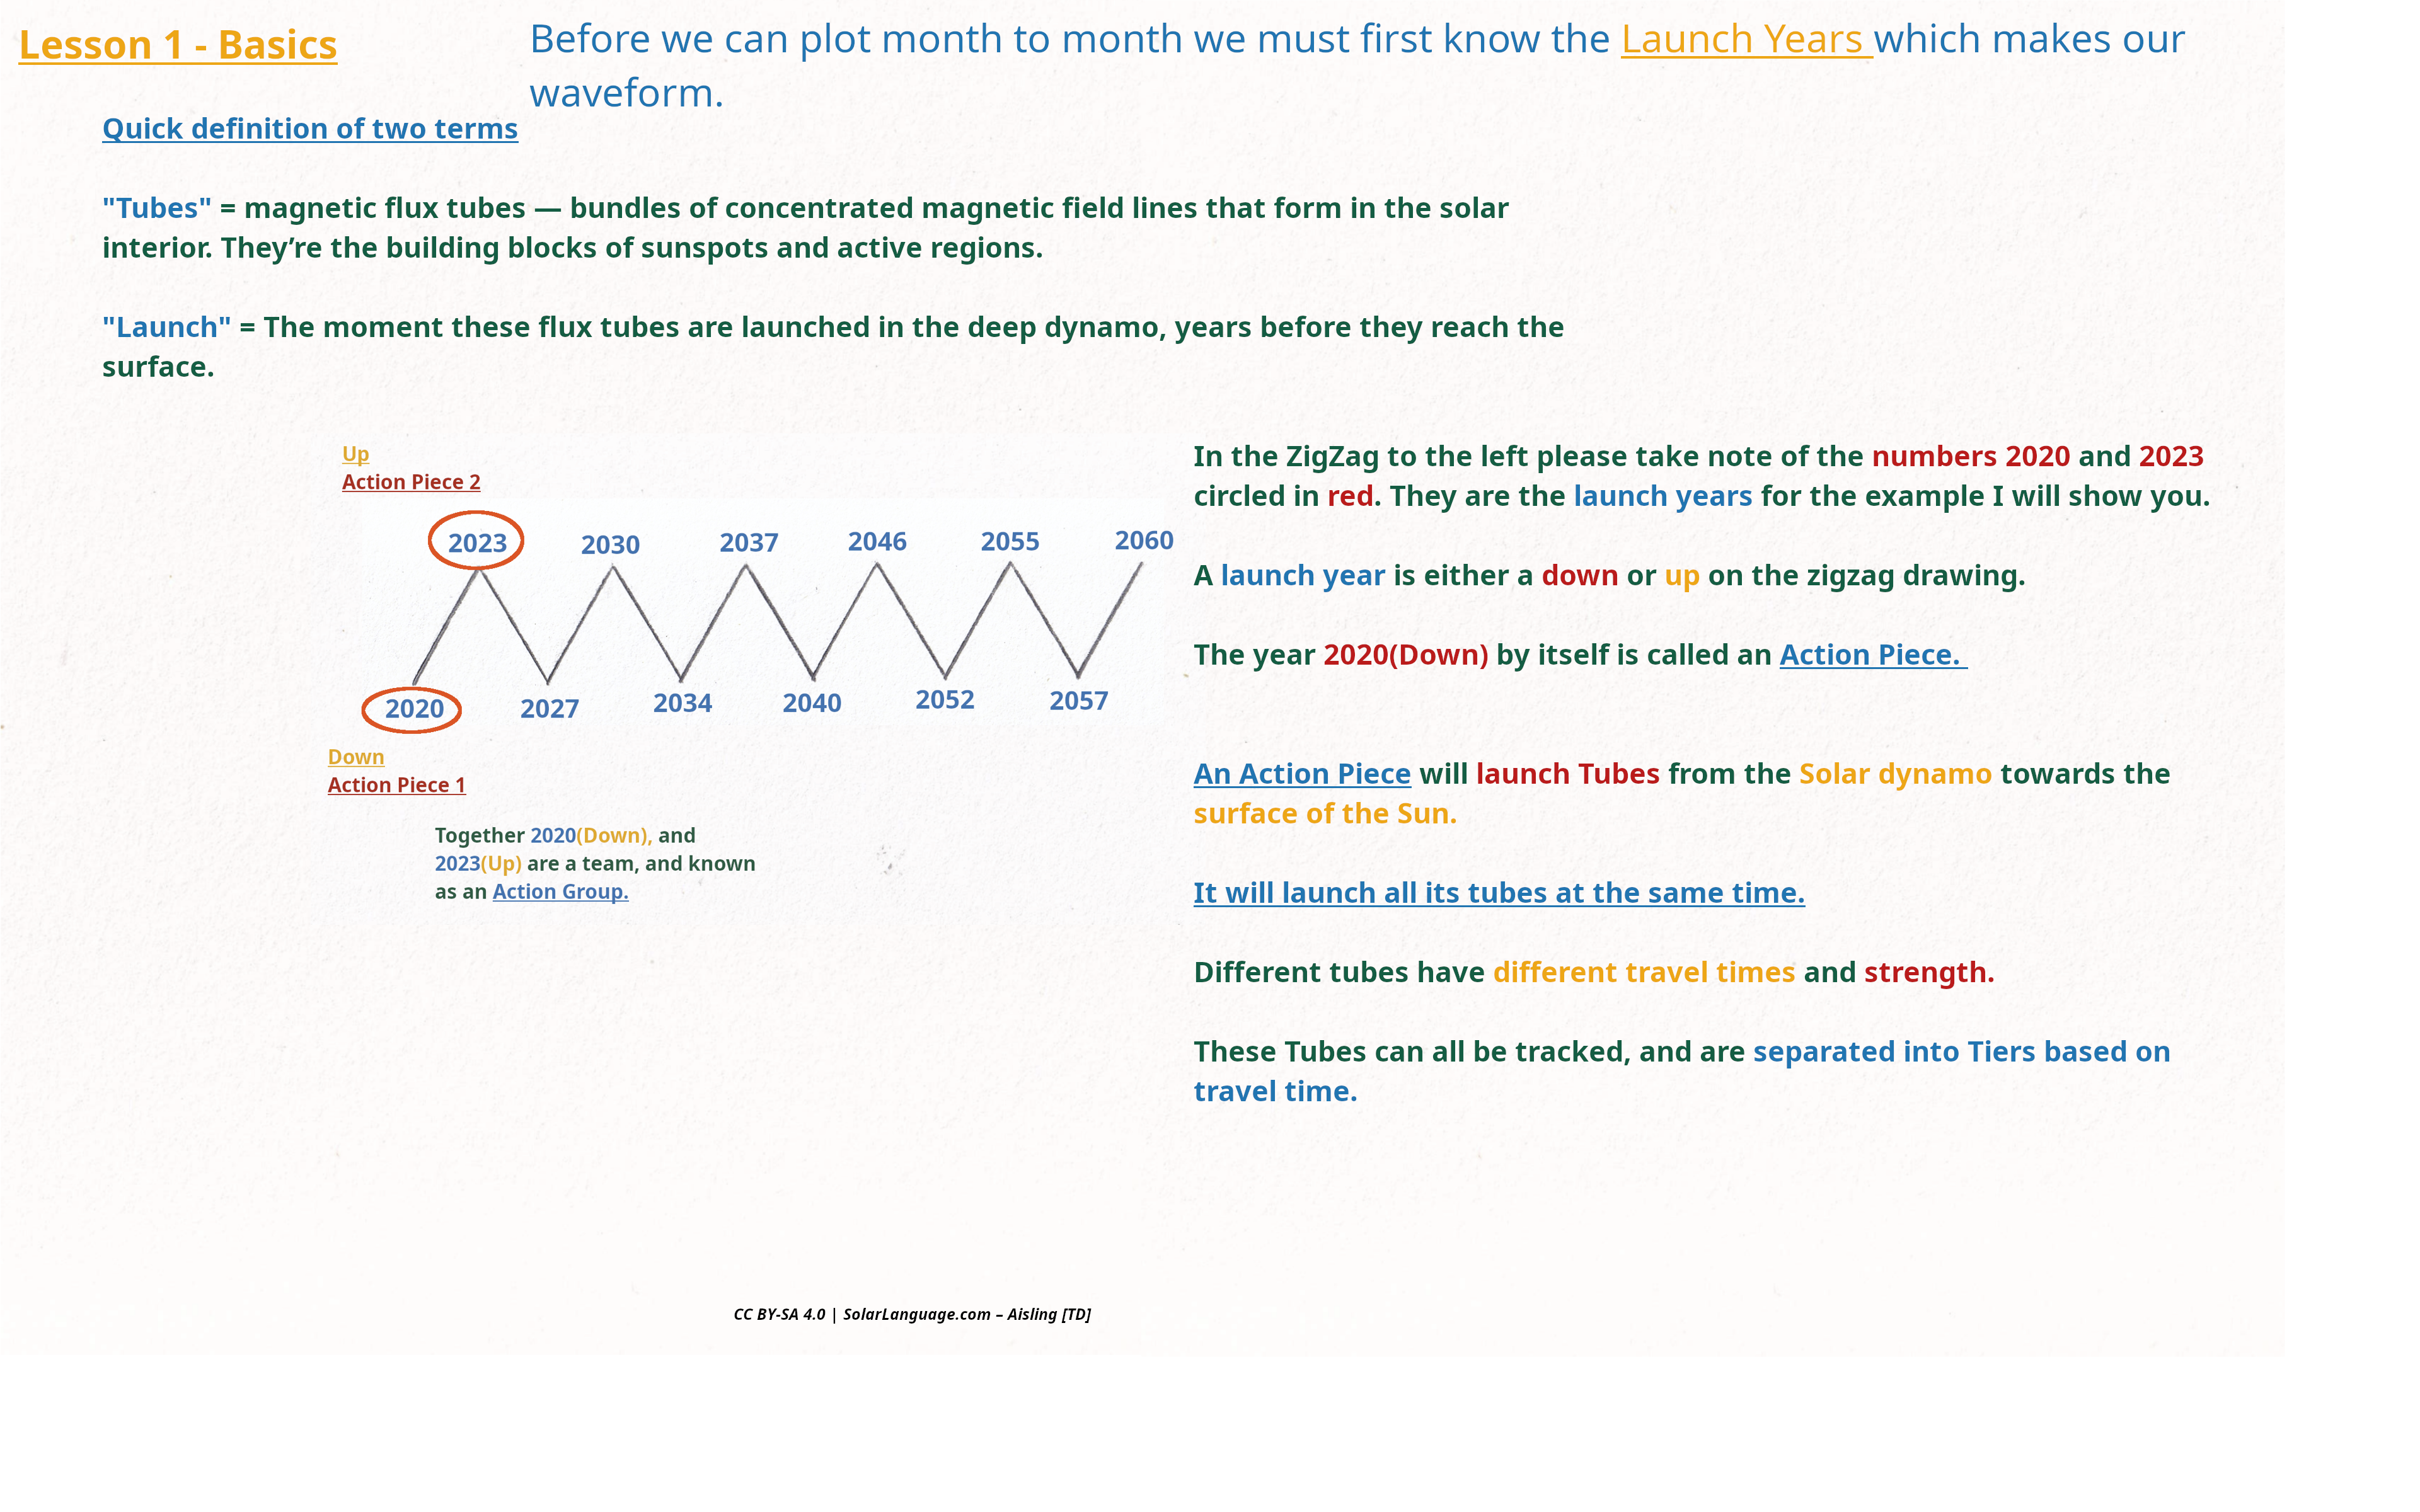
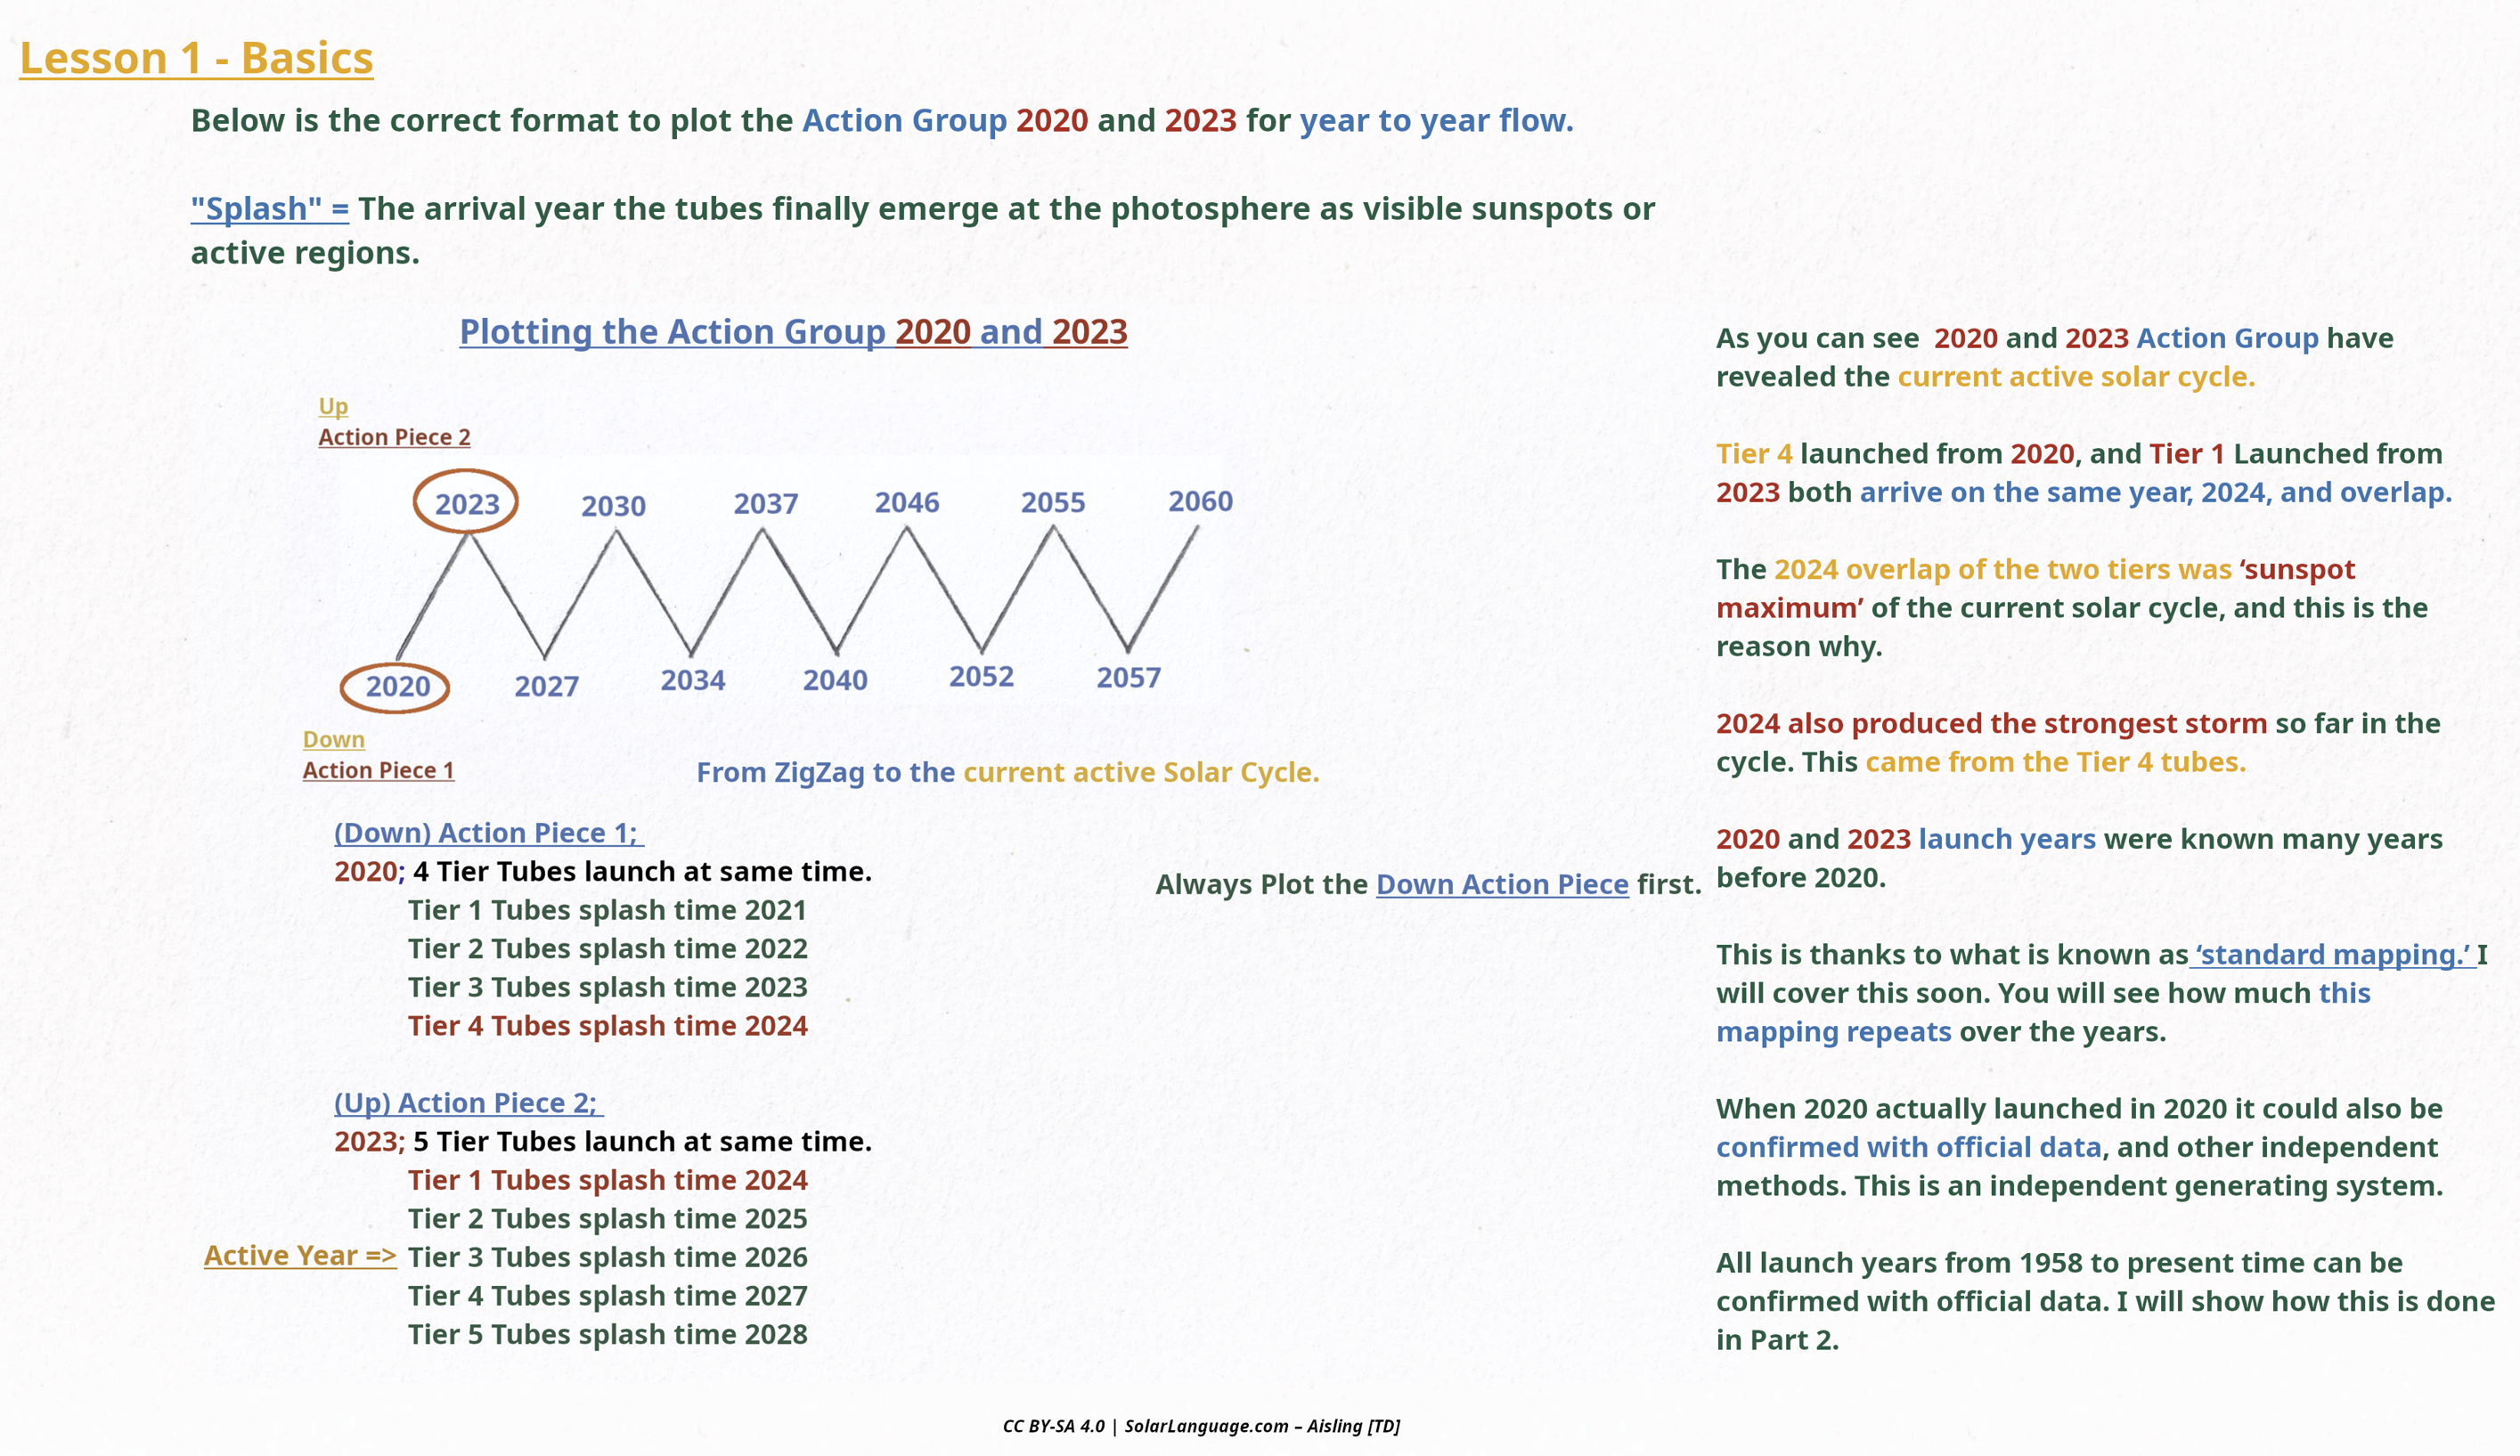
Lesson 1 - Basics
Introduction to the Solar Dynamo Language
My team is the first to fully map the Sun’s Dynamo. This now allows anyone, including you, to plot any solar activity at any point in time.
It is tested from 1120 AD, and also captures the correct solar cycle including if its a solar max or solar min.
Famous solar storms from 1204 AD to 1770 to 2024 including the next upcoming major activity in 2035.
This same structure is fully testable and reproducible.
I recommend sticking to the 1700’s to 2026 for now as its easier to confirm the results with official sources.
You will see how the 20 – 22 year complete solar cycle emerges naturally.
Let’s Start
Below are 3 Dynamo Cycles. Each of them are around 100 years in length, and all contain exactly 30 Flux Tubes Launches.
Each Flux Tube launch contains 4 to 6 years of surface activity. The exact length is determined by using a tier plotting diagram listed further below this one and also never changes. We will use it to plot any solar activity at any point in time.
Three 100 year Dynamo Cycles
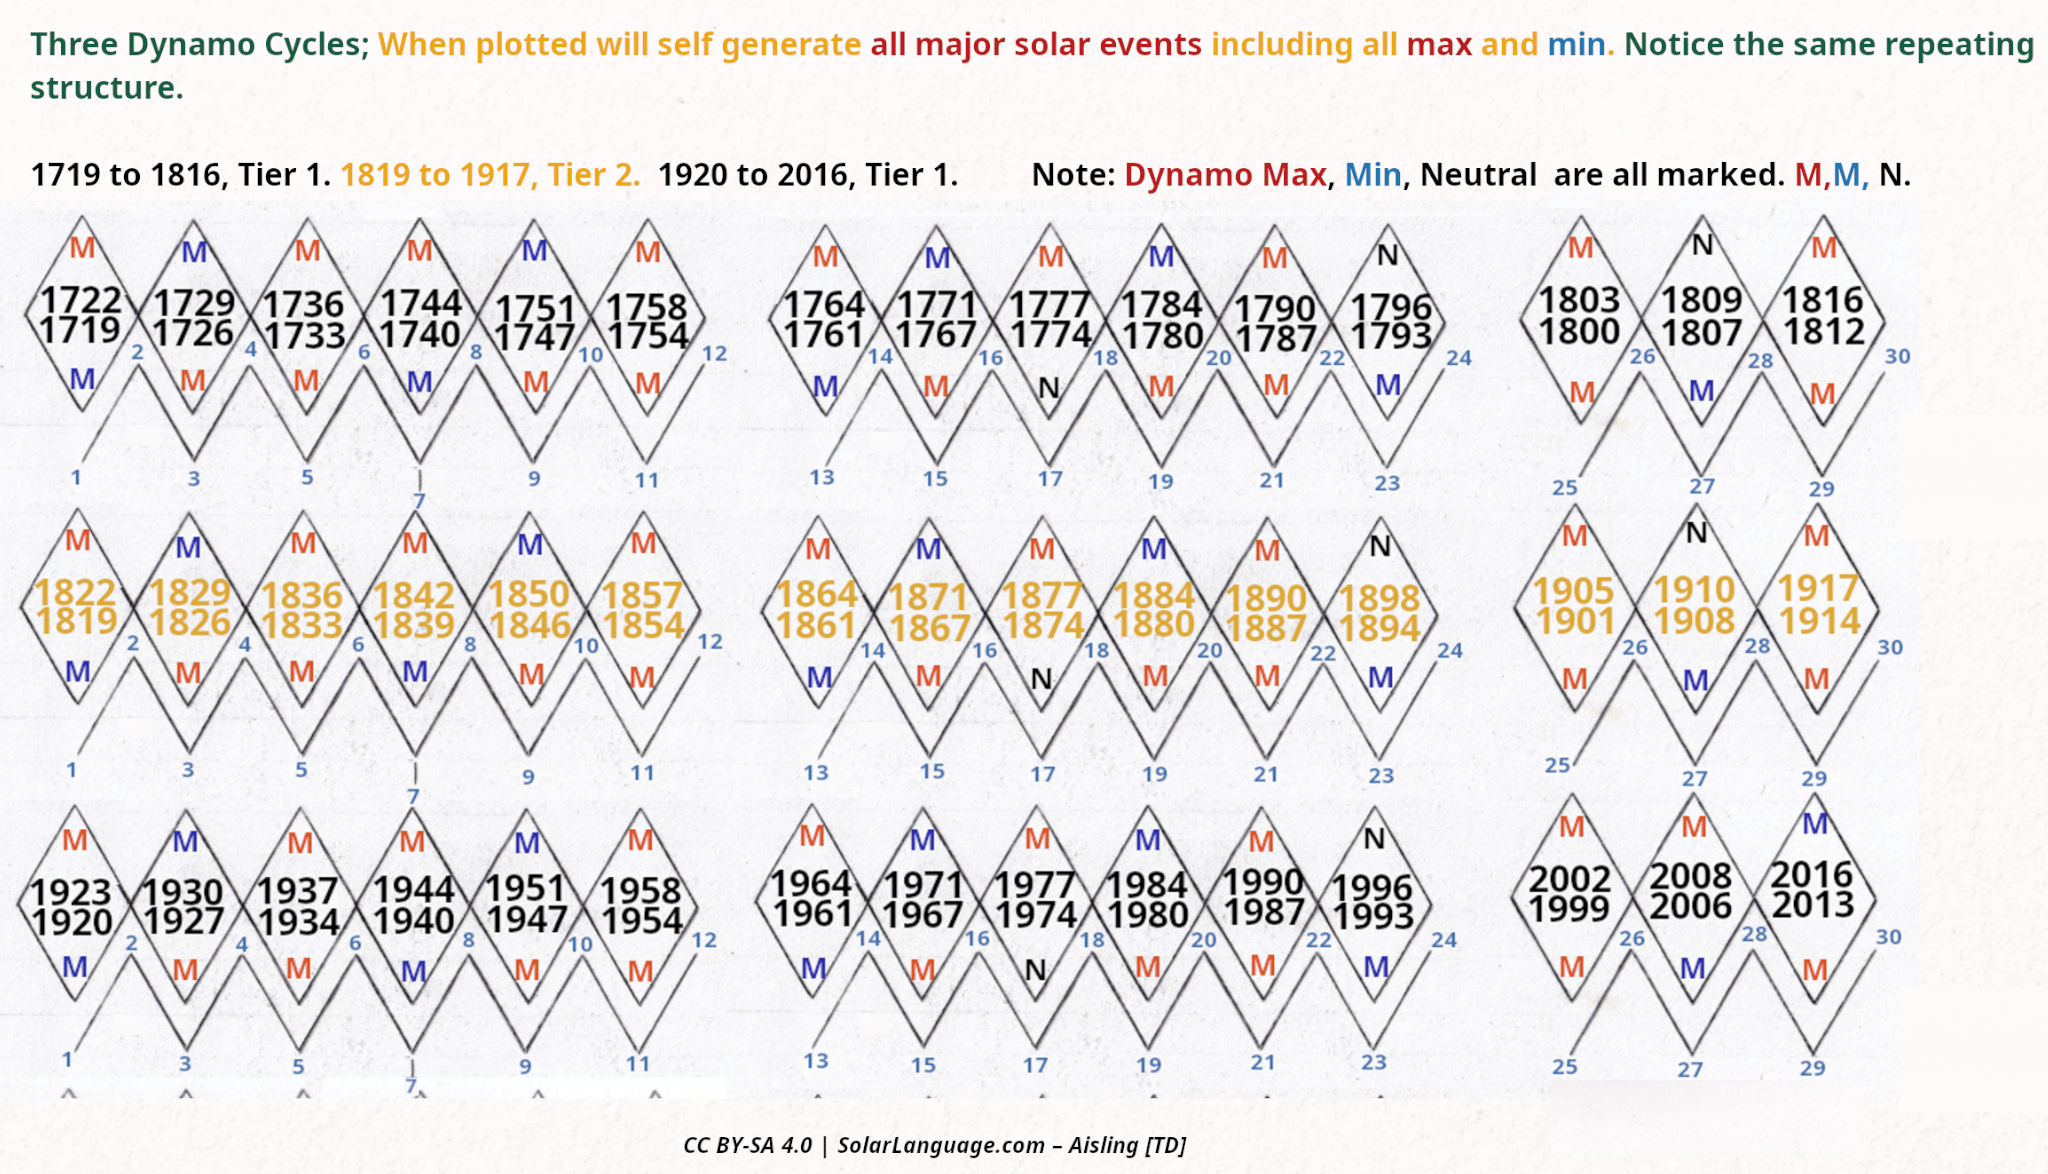
300 years of solar activity with the same repeating structure. When using the tier plotter below one can self generate all major solar activity from the year 1719 to 2016 – Any period from low to high, and will match exactly.
Dynamo Tier Plotter
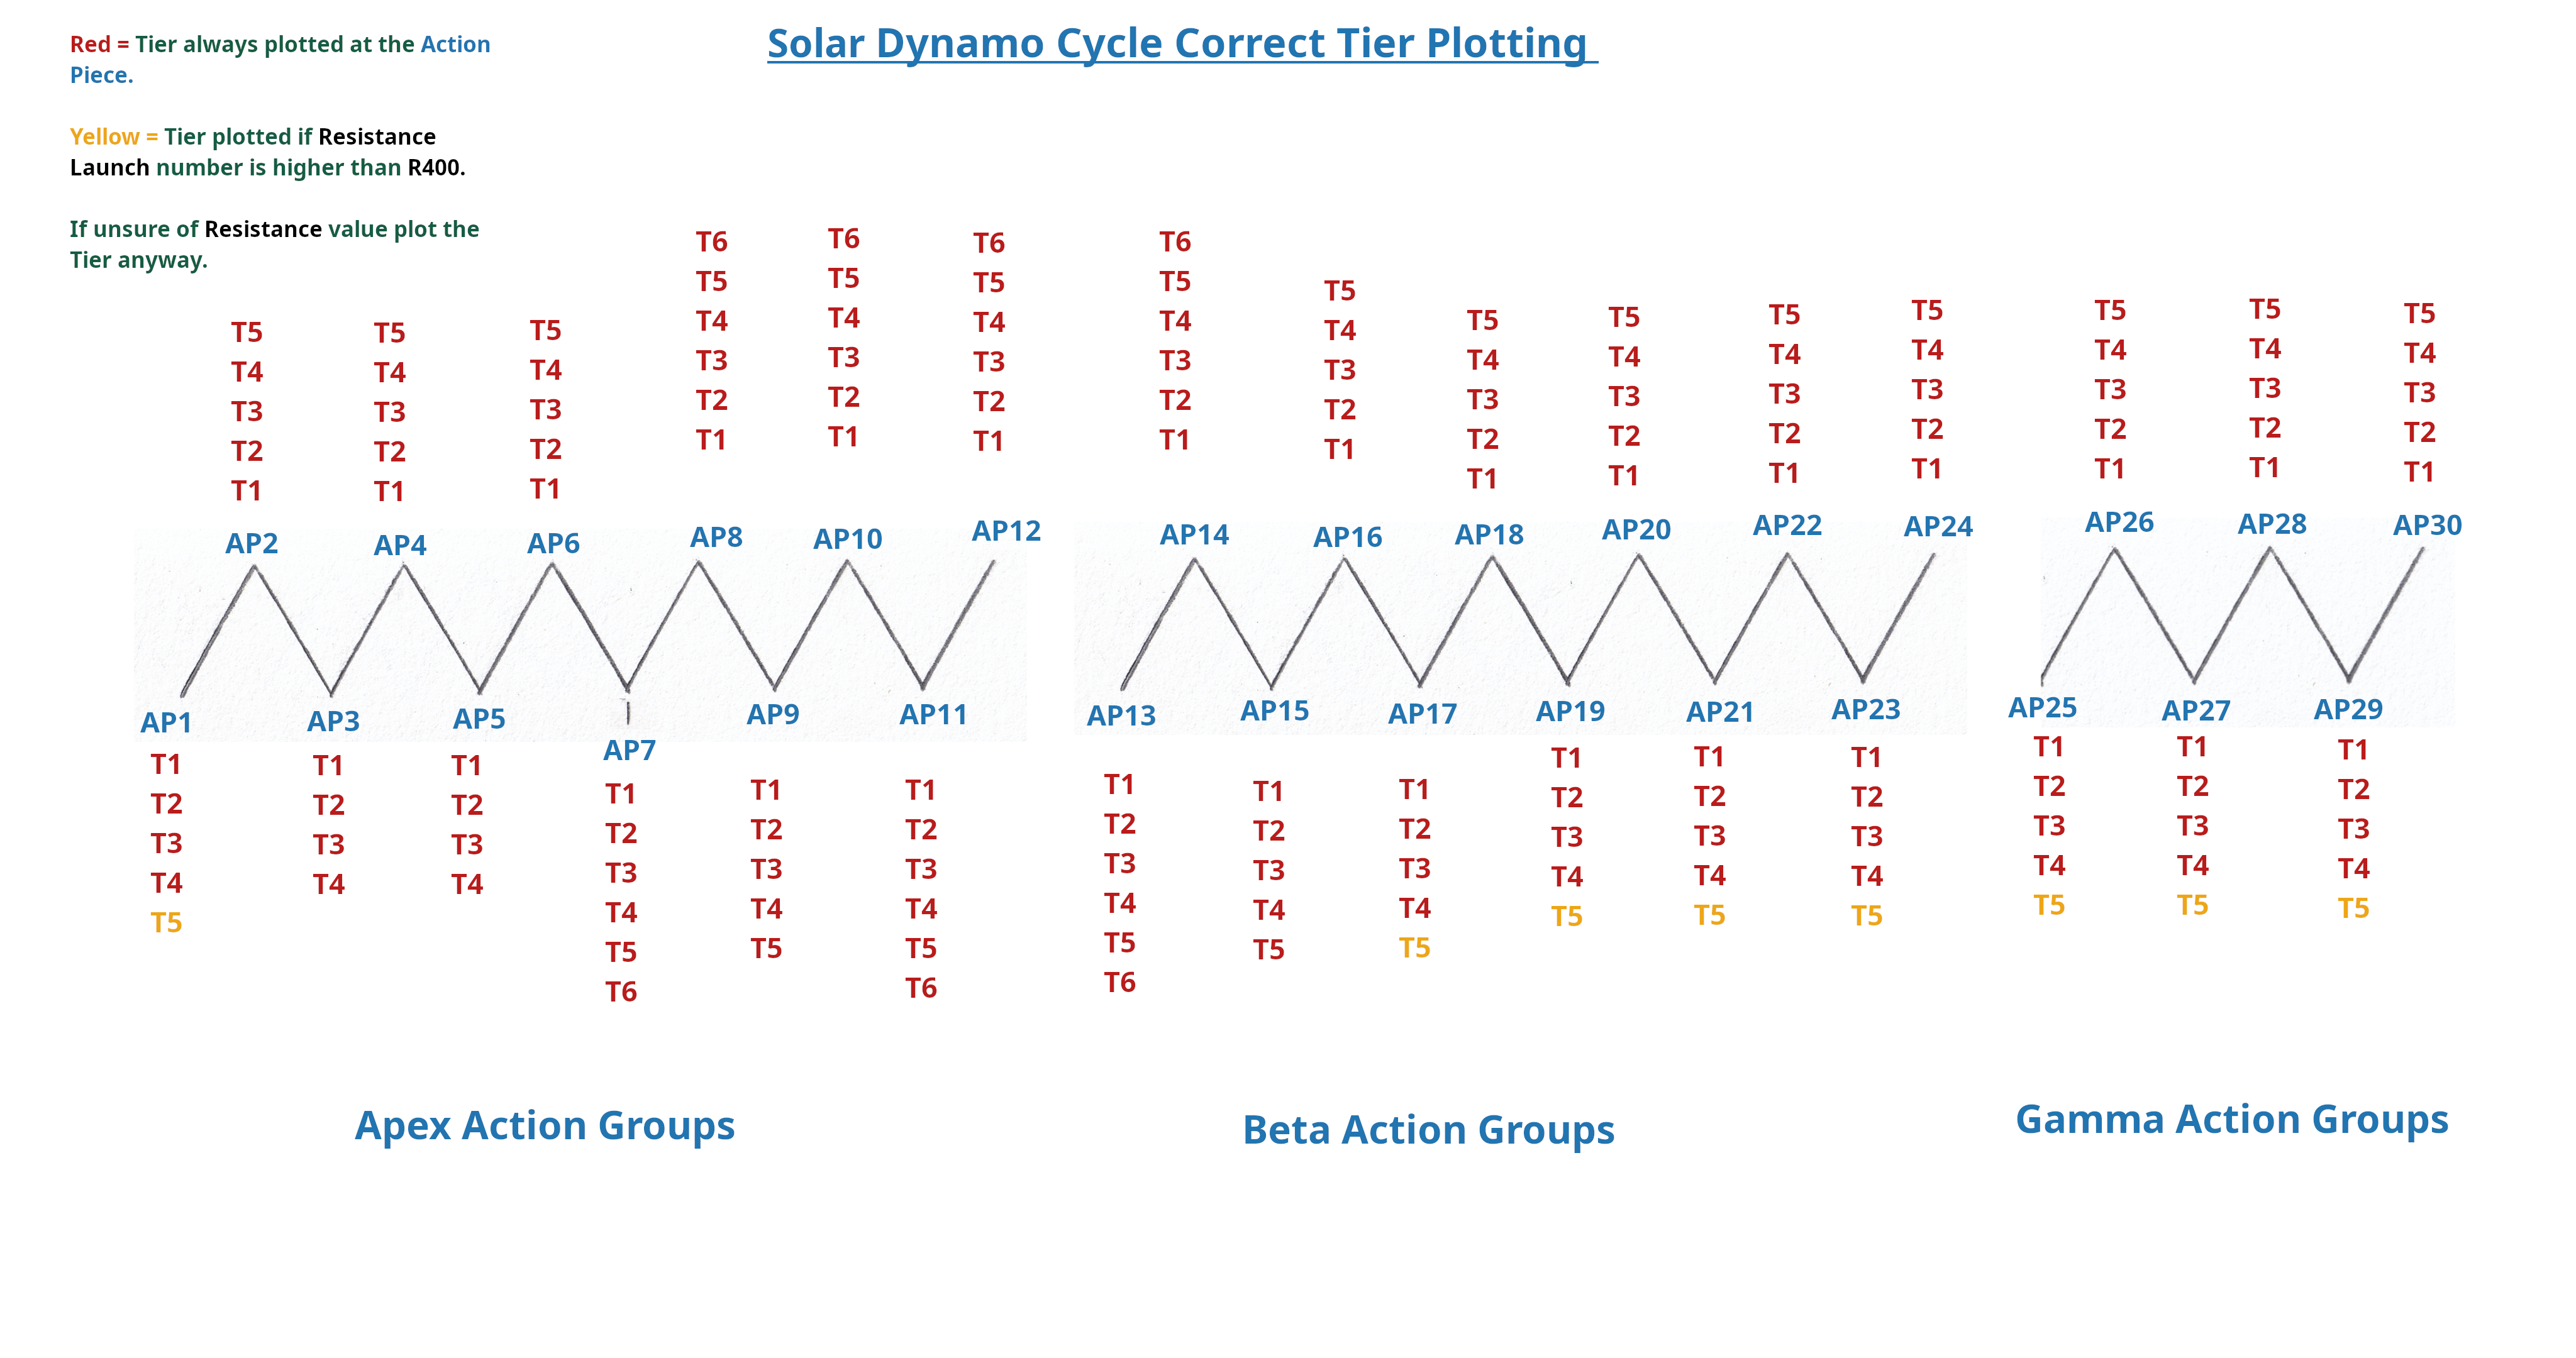
The 100 Year Dynamo cycle - 1819 to 1917

This is the 100 Year Dynamo cycle and contains the major activity that created our Carrington Storm. It also contains other famous storms like the 1921 railroad storm too.
It is a Tier 2 Dynamo Cycle. The other two – 1719 to 1816 and modern 1920 to 2016 are both Tier 1 and the most common. For the purpose of this demonstration there is no real difference between these Cycle Tiers besides slight changes in timings in specific locations.
Below is the Lozenge (Diamond) section containing Carrington.
The Diamond containing Carrington 1859
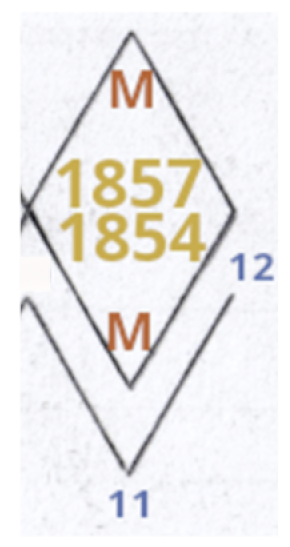
Let’s unpack it.
It contains two years, 1854 and 1857. These are the years the Dynamo launched its Flux Tubes towards the surface of the Sun.
To zoom in further it is not just the Dynamo which launches these Flux Tubes, but specific areas within the Dynamo.
These are referred to as ‘Action Pieces’ and each Dynamo Cycle has 30 of them – Our 30 Flux Tube Launches.
(I will show you soon why it is always 30 launches/Action Pieces and what triggers them.)
The section containing Carrington is numbered 11 and 12.
This means AP11 and AP12 from the plotting diagram above.
AP = Action Piece 11 and Action Piece 12. Two Action Pieces together is referred to as an Action Group.
On the plotting diagram above AP 11 and AP 12 both run from T1 to T6.
Flux Tubes Makeup
Flux Tube launches are broken down year by year, and further again down to month by month. For now I will focus on year to year.
A T6 Flux Tube Launch contains six years of surface activity. From Tier 1 to Tier 6 each will spend a year on the surface of the Sun producing active regions and sunspots.
Tier 1 is the first to arrive, one year after launch, and is the weakest.
All Tier flux tubes will begin and end around the same time each year, the 10th of January. Tier 2 will then replace it at the same time.
The final Tier 4 to Tier 6 tubes will produce the strongest activity, and are responsible for all major solar storms.
Lets apply the first level of a basic plot.
The Diamond containing Carrington 1859
We have the Action Group, two launch years containing two Action Pieces, 1854 and 1857.
An Action Piece is either known as a DOWN Action Piece or an UP Action Piece.
DOWN and UP are two states of change within the foundation level of the Sun’s Dynamo.
If you could look at it with the naked eye you would see it visually change its shape between these states over several years.
It is this precise moment – when the Dynamo begins to change from one state to another that the Flux Tubes are launched.
At no other point will the Dynamo ever launch Flux Tubes.
To go into more detail it is not the ‘Foundation level’ of the Dynamo which physically launches these tubes, but the upper layer near the surface of the Sun – still a little deep with 6 year travel times for some, but when looking at the Sun as whole – pretty close to the surface!
Normal Dynamo State Of Change
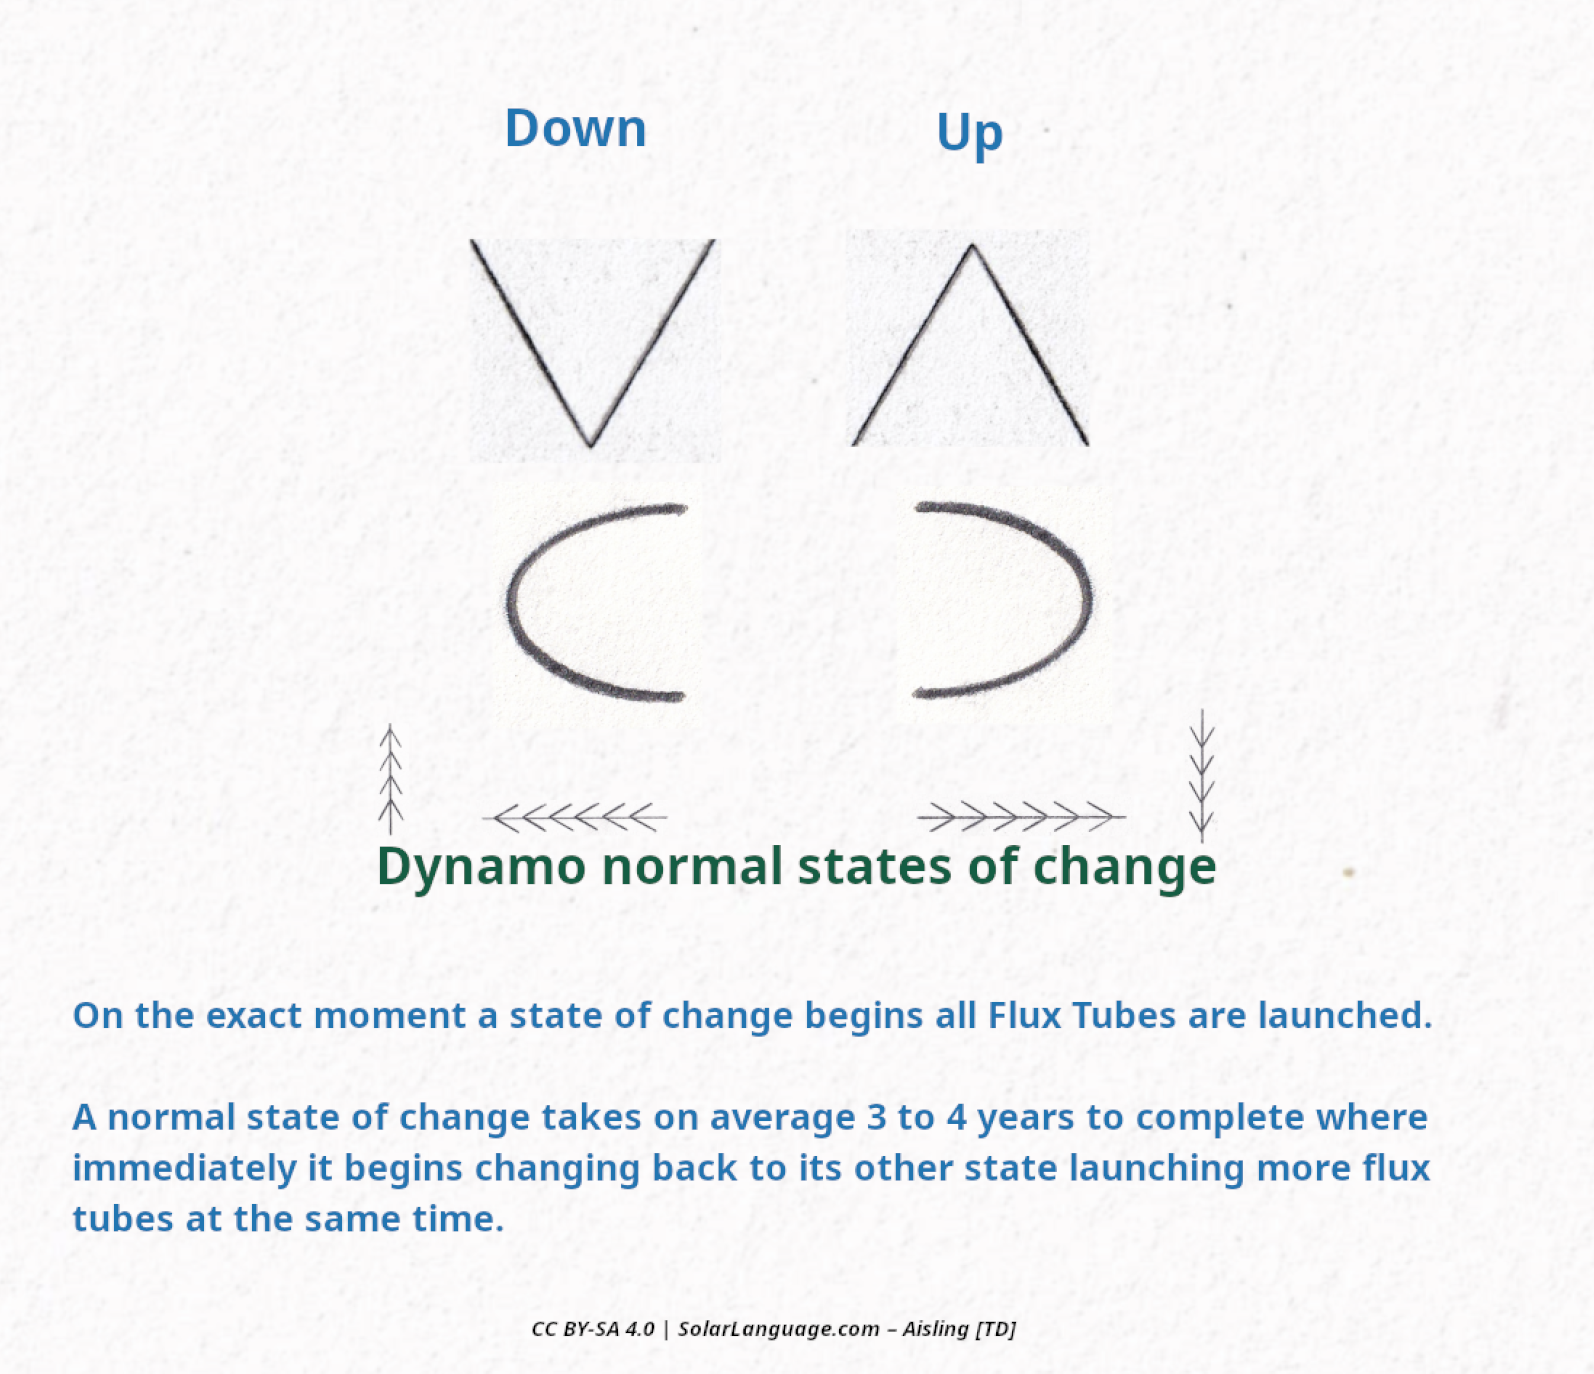
Always Plot the DOWN Action Piece first.
We always plot the DOWN Action Piece first. It is easy to identify, as the DOWN Action Piece is always the bottom year inside the Diamond.
The UP will always be the top year inside the Diamond.
Note: "Splash" = The arrival year the tubes finally emerge at the photosphere as visible sunspots or active regions. The listed year, and always within a few days of 10th of January.
Basic Plot
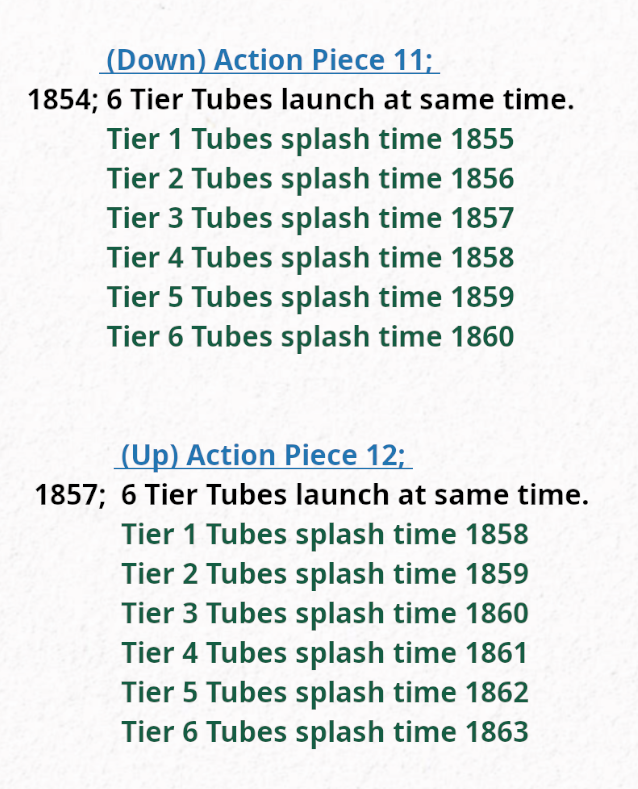
This is our basic plot.
Now we need to apply the next layer – the solar max, or min, and why they form.
Dynamo Max
Dynamo Max (Marked as a Red ‘M’ inside the Diamond) Dynamo Max is an Action Piece that produces the ‘Solar Max’ cycle. There is always two ‘Dynamo Max’ Action Pieces together. Never any less nor more.
Dynamo Min
Dynamo Min (Marked as a Blue ‘M’ inside the Diamond) A ‘Dynamo min’ Action Piece always follows the last Dynamo Max Action piece and produces the ‘Solar minimum.’
Dynamo Neutral
Dynamo Neutral (Marked in Black as ‘N’ inside the Diamond) This only appears in the same specific areas in a Dynamo cycle – never changes.
If you only count sunspots, a Dynamo Neutral can appear to mask itself as a Dynamo Min until it overlaps with a Dynamo Max, and then suddenly comes to life fuelling the Dynamo max. i.e the 1903 Solar Storm.
How the rule based Dynamo Max and Min order changes the Magnetic cycle of the Sun over two sunspot cycles. (20 – 22 years)
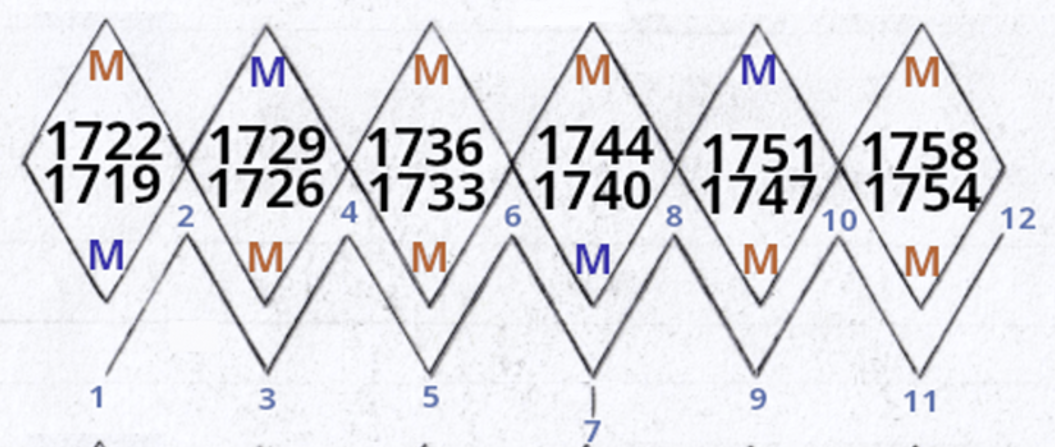
1700s Dynamo Cycle Start
Lets take a look at the start of the 1700’s Dynamo cycle above.
Note the Red M = Dynamo Max. The Blue M = Dynamo Min. Notice how they change through the years sticking to the rules I mentioned above.
After around 20 – 22 years they (The diamond) return to their original state. (Same Blue and Red ‘M’ configuration.)
1719 – 1740 = 21 years // 1722 – 1744 = 22 years // 1729 – 1751 = 22 years
1736 – 1758 = 22 years. And so on...
Solar Max and Min
These produce all the solar max and min.
Remember, the DOWN (bottom year is always plotted first.)
The very first diamond contains AP1 1719 and AP2 1722.
The AP2 1722 comes with a Red M, and will produce a Solar Max period along with AP3 1726 from the next Diamond.
(Always two Dynamo Max Action Pieces together.)
The order of this solar cycle is not as efficient.
AP2 1722 (UP. Dynamo Max) then AP3 1726 (DOWN. Dynamo Max)
Fuelled the 1730 storm. (Tier 4 Tubes from 1726 (Down))
*Solar minimum must follow*
AP4 1729 (UP. Dynamo Min) is a blue M as required, and will produce the solar minimum.
A Dynamo Max must follow unless there is an N (Neutral Action Piece.)
This solar cycle is much more efficient.
AP5 1733 (DOWN. Dynamo Max) then AP6 1736 (UP. Dynamo max)
This solar cycle Fuelled the famous 1737 storm.
(Tier 4 Tubes from 1733 (Down))
(You will find the ‘Down’ Action piece tends to produce/fuel the strongest storms,
and having it at the start of a cycle makes for more impact)
The Two Solar Cycles Plotted
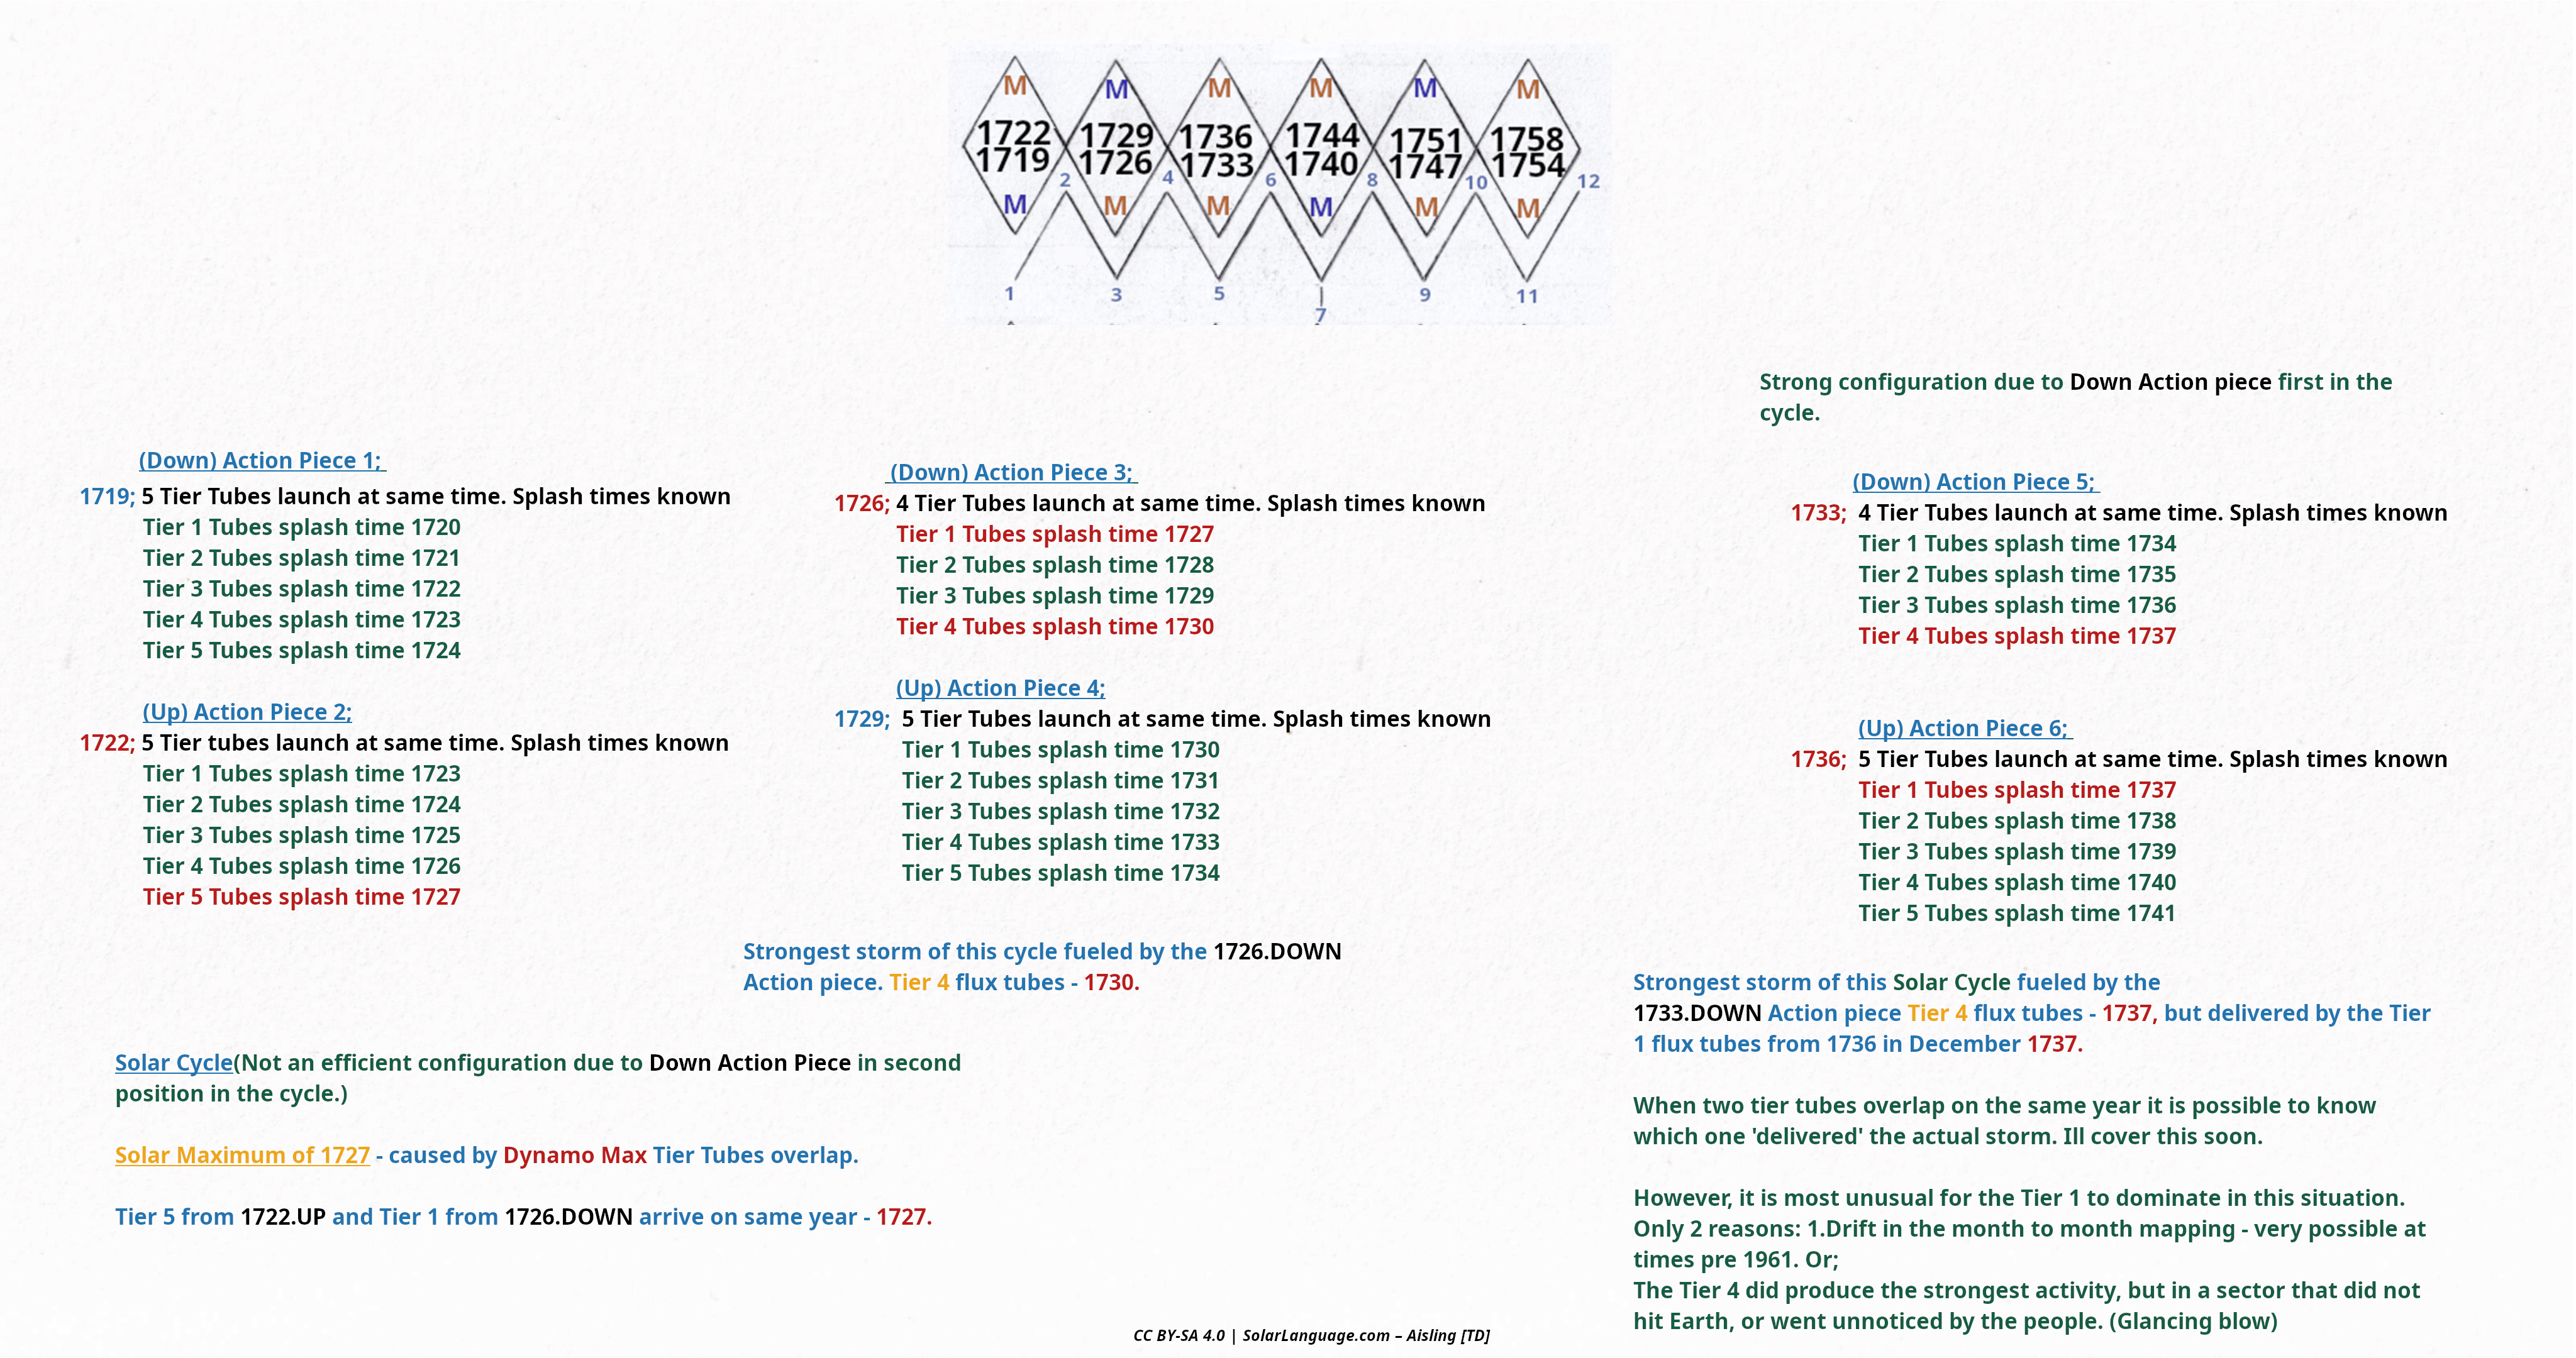
The solar cycle that made Carrington is in an efficient configuration. (A Down – Up, Double Red M)
In simple terms when both Dynamo Max belong to the same diamond they perform at their best.
This exact same configuration (Double Red M) gave us 1957/1958/1959, and
1989 super storm. The beautiful (Good times) 2000/2001 and 2003 famous storms. It also gave us the 2024 storms.
Our Carrington plot below with the correct M configuration applied.
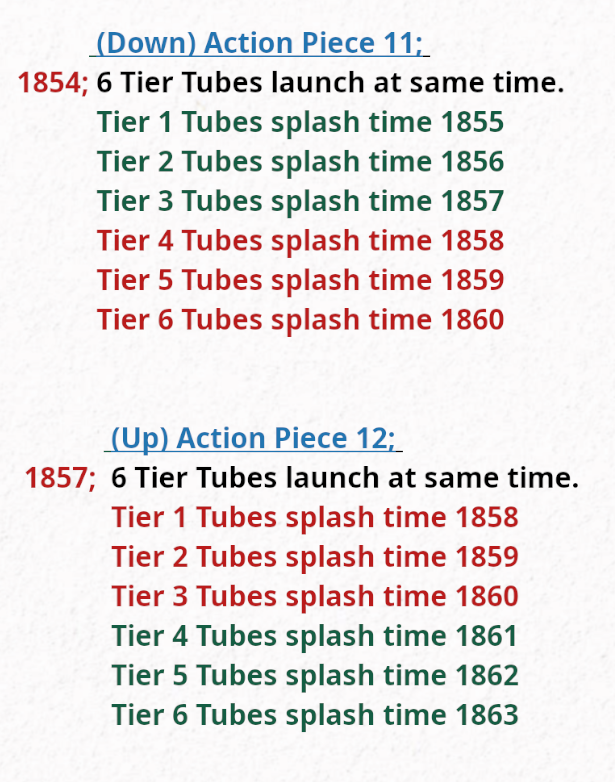
- Both years are coloured red, as they are both Dynamo Max Action Pieces, and will produce a solar max period.
- Notice how the Flux tubes from different launches overlap on the same years. Coloured in red.
- This greatly increases the strength of these tubes, and the Double M configuration makes them even stronger.
- Overlapping tubes also gives us the ‘Sunspot Max period.’
- It is also worth noting this is generally one of the strongest locations in a Dynamo cycle.
- We have 3 tubes overlapping over 3 years when in a normal situation you only get one like in 2024.
Important Questions
Why did Carrington arrive in 1859, and not 1860 where it is even stronger? This section will nearly always have a strong Tier 5. Lets take the modern 1959 storm -429nT. Came straight from a Tier 5 also. Tier 6 gave us 1960 at -339nT.
Tier 5
Other Tier 5’s of Note are 1972, 1989, it fuelled this year by overlapping with a Tier 2 Dynamo Max. 1982.Tier 5(N) Fuelled the 2001 by overlapping with a Tier 2 Dynamo max.
The upcoming 2035 major activity – first time a Tier 5 gets a good primary setup since 1982.(It wont be a Carrington event, but it does have an interesting and unusual quirk that is worth monitoring.)
Tier 6
A Tier 6 will only become effective at much higher energy levels.It is very, very rare for it to unleash its full potential – every couple of thousand years.
It did give us a few interesting storms in the modern era.
1770/1848/1870/March 1946 and fuelled the July1946 overlapping with a Max Tier 2 tube. 1960/1967 and 1970.
(You can plot all the above, you will see they also match all the sunspot cycles perfectly too.)
Our next Tier 6 is launching in 2040, and arriving in 2046.
Due to the unusual changes in 2008 which flipped the order of the Dynamo Max and Min at the Neutral Point, this Tier 6 will be a 2040(Down. Dynamo Max) and joined by a 2046(Up. Dynamo Max.) Strong configuration.
Tier 4
The Tier 4 will take a back seat generally when there is T6 involved, but in the lower levels of the Dynamo cycle it is the backbone of all Major storms.Tier 4 brought us the 2003 Halloween storms. The 2024 storms. It also gave us the 1921 famous railroad storm. It was also responsible for the 2012 near miss.
Anything lower than Tier 4 requires a boost from another overlapping Tier to make an extreme storm.
Additional Features
There is also two other stats not added to the Carrington plot above, and concern the energy rating and energy potential of each year.Pre 1961 this is estimated to a high accuracy. Post 1961 it is able to uses official data to calculate energy potential and has so far proved itself very effective.
Running it from 1961, it detects all extreme events several years early at their launch including 1989(detected in 1984) and the 2012 near miss(detected in 2008).
Advanced feature and will give an introduction to it later in the lessons.
1859 – Tier 5 or Tier 2 – Which one triggered Carrington?
In 1859 we have Tier 5 Flux Tubes from the 1854(Down) Action Piece launch, and Tier 2 Flux Tubes from the 1857(Up) Action Piece launch.
In this situation as both are Dynamo Max, the higher tier will always dominate especially if its from a (Down) Action Piece.
It is possible to confirm which one. So lets brake open the flux tubes and find out exactly.
I will show you what the flux tubes look like when broken down to the month to month level.
2026 Current Active Year
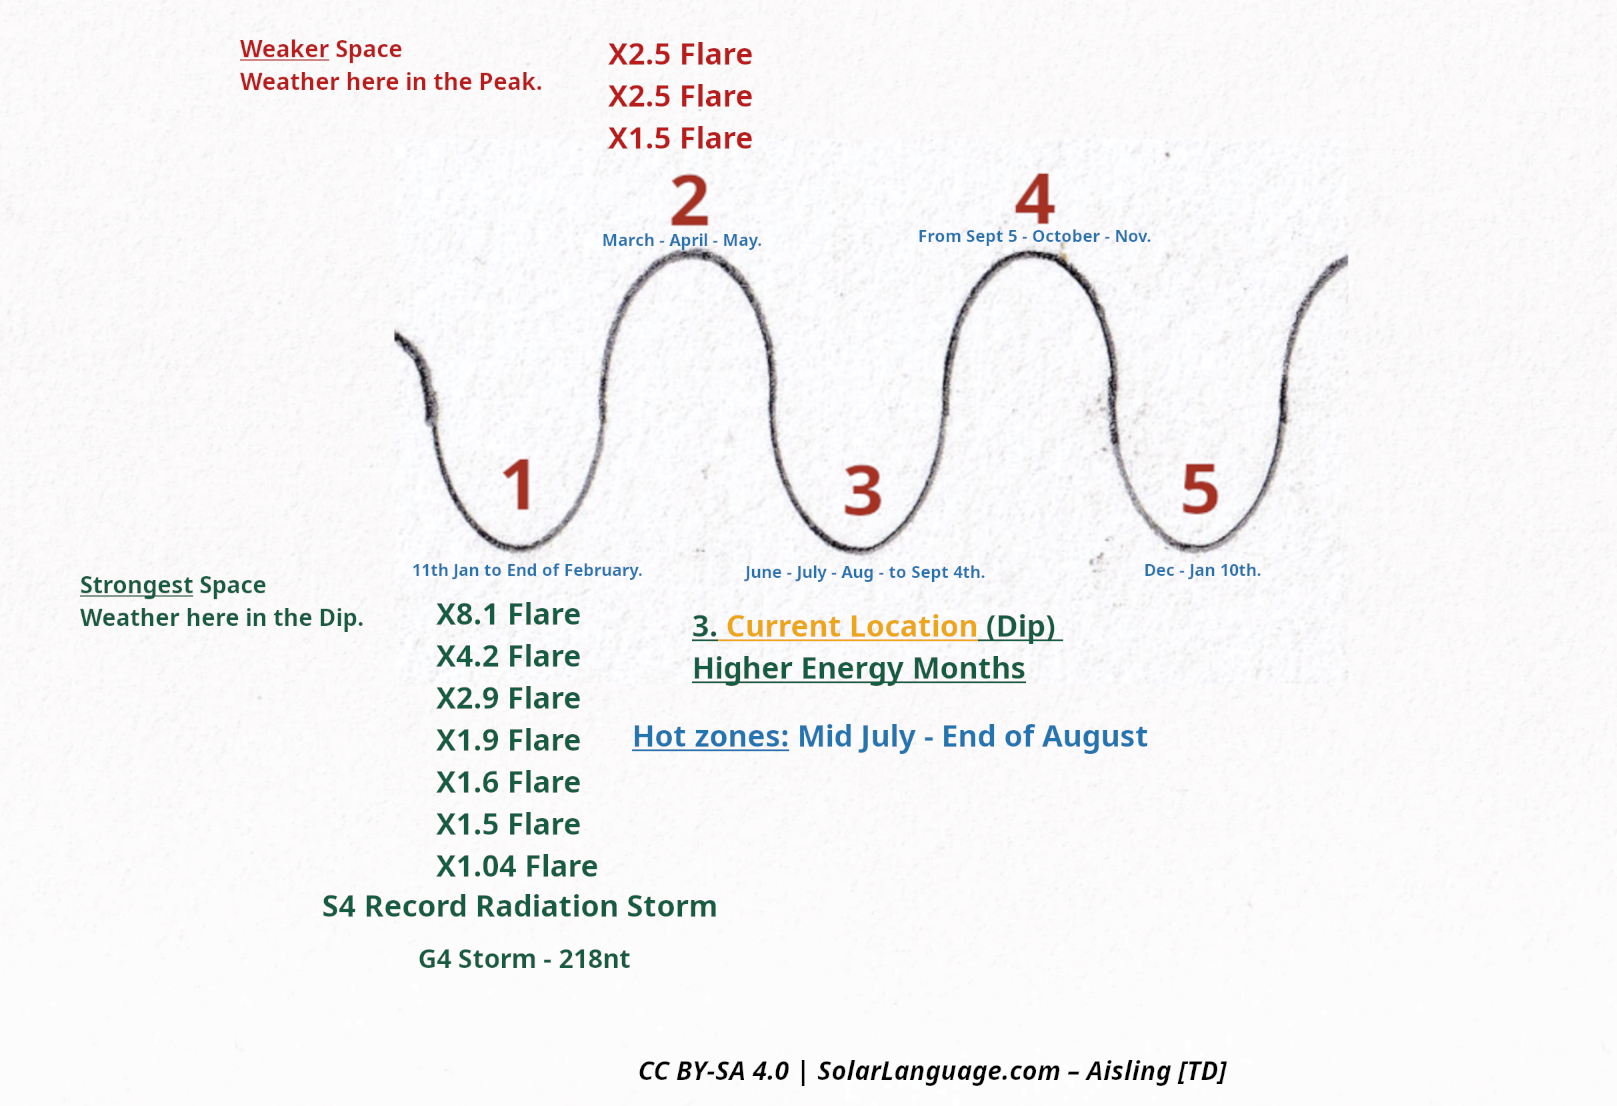
The wave shape above is tuned to show which months can have strong Earth directed solar activity, and which must have weaker activity.
Flux Tubes Month to Month
- Every year Flux Tubes change direction exactly 5 times (Zones numbered 1 to 5)
- This is due to the foundation level of the dynamo, the main flow changes direction 5 times and forces every flux tube in motion no matter its location to change direction.
- Note: The change in direction occurs at the same times every year. Never changes.
- Every year this flow takes a specific path and this changes the wave shape of our flux tubes. The Foundation level Dynamo alternates every year between these two paths.
- The end result is two specific flux tube shapes, and both wave shapes are tuned for Earth directed higher energy activity.
- This allows the user to perfectly zero all incoming major solar activity years in advance to the correct months of arrival.
- There is no prediction. It happens exactly as its suppose too.
- I will now show you the 2025 flux wave shape. See how it joins to 2026. The exact same dates are used too. Never changes!
2025 and 2026
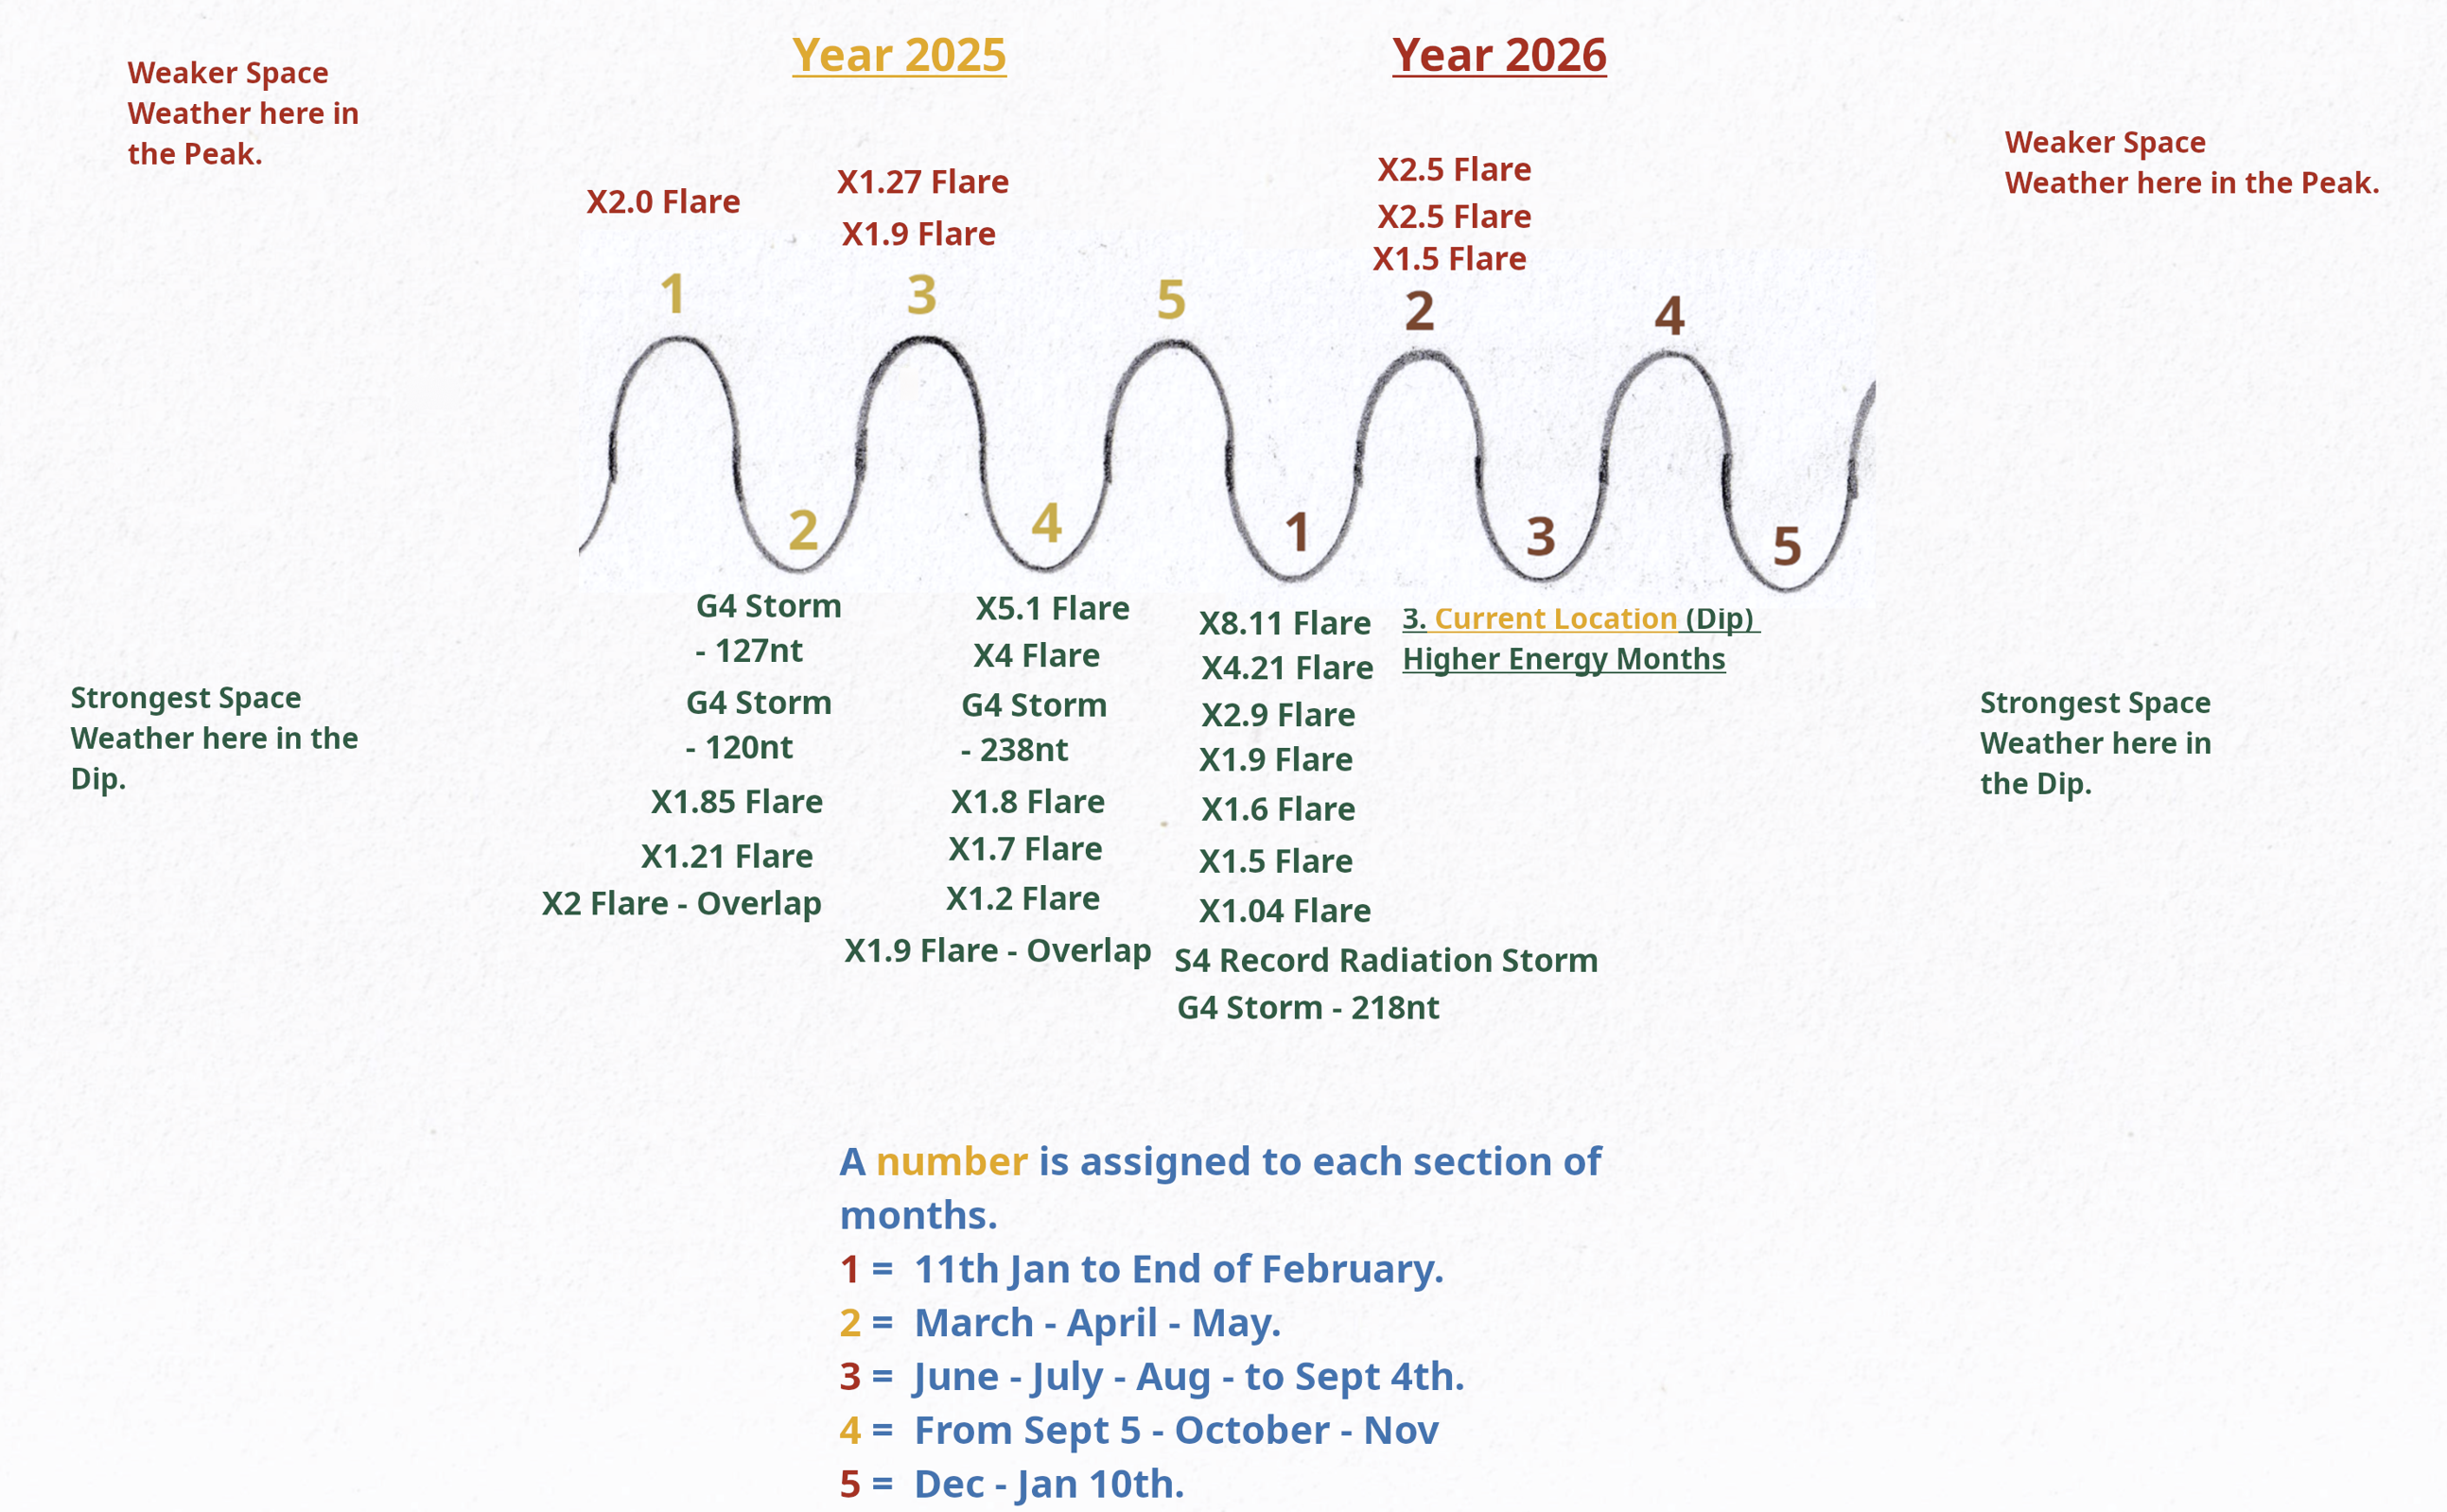
The system is tuned for Earth directed activity. This means the strongest activity of the year is always in the ‘Dips’ of the waves. As you can see they are written in green, with weaker activity written in red.
Note: Extreme events can only happen in the ‘Dips’ of the waves.
Below is the first Flux Tubes launch of this current Solar cycle.
2020 Flux Tubes (One of the two main launches of the current Solar Cycle)
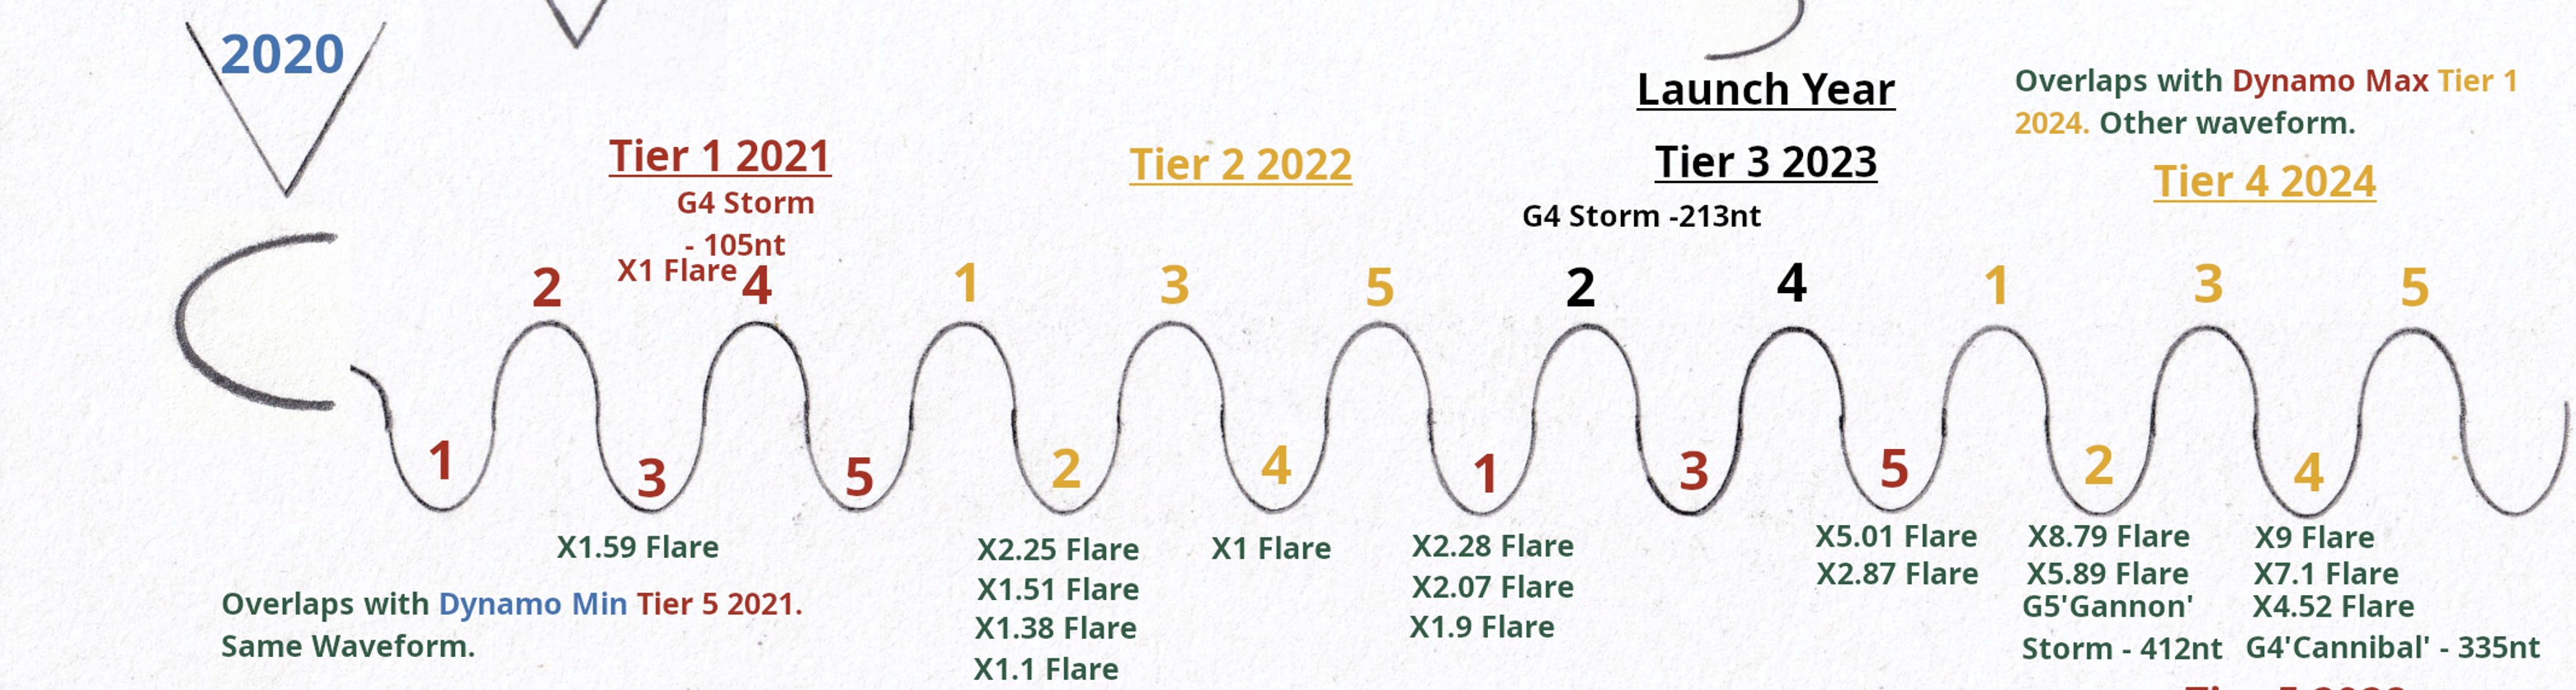
2020(Down) with a Tier 4 delivered us our 2024 storms exactly in the ‘Dips’ of the flux waves. Very easily seen long in advance, and it was, just like 2035, 2038, and 2046.
Nothing particular magical or amazing here. This is just standard Dynamo mapping and the novelty will wear off fast when you start to learn the more advanced features. (We can go much more advanced than this.)
-
For 2035, the energy information released to the Action Piece will be known in 2030, and a strong estimate two years before this.
-
For 2038 we will get the energy information in 2037, but can estimate it by 2035.
-
For 2046 we will get the required energy information in 2040 along with a signature detection that can be confirmed with official data
– this will confirm if it will be an extreme event – Carrington class or greater – 6 years early.
-
All this major activity can be zeroed to the correct months too.
- This is the benefit of fully mapping the Dynamo of the Sun. In a digital age it should be standard.
In an UP Action Piece the Flux Tubes launch also boosts the ‘peaks’ of the wave for Earth directed activity, but it disrupts the ‘dips’ of the wave preventing them from working to their full strength.
The full current cycle.
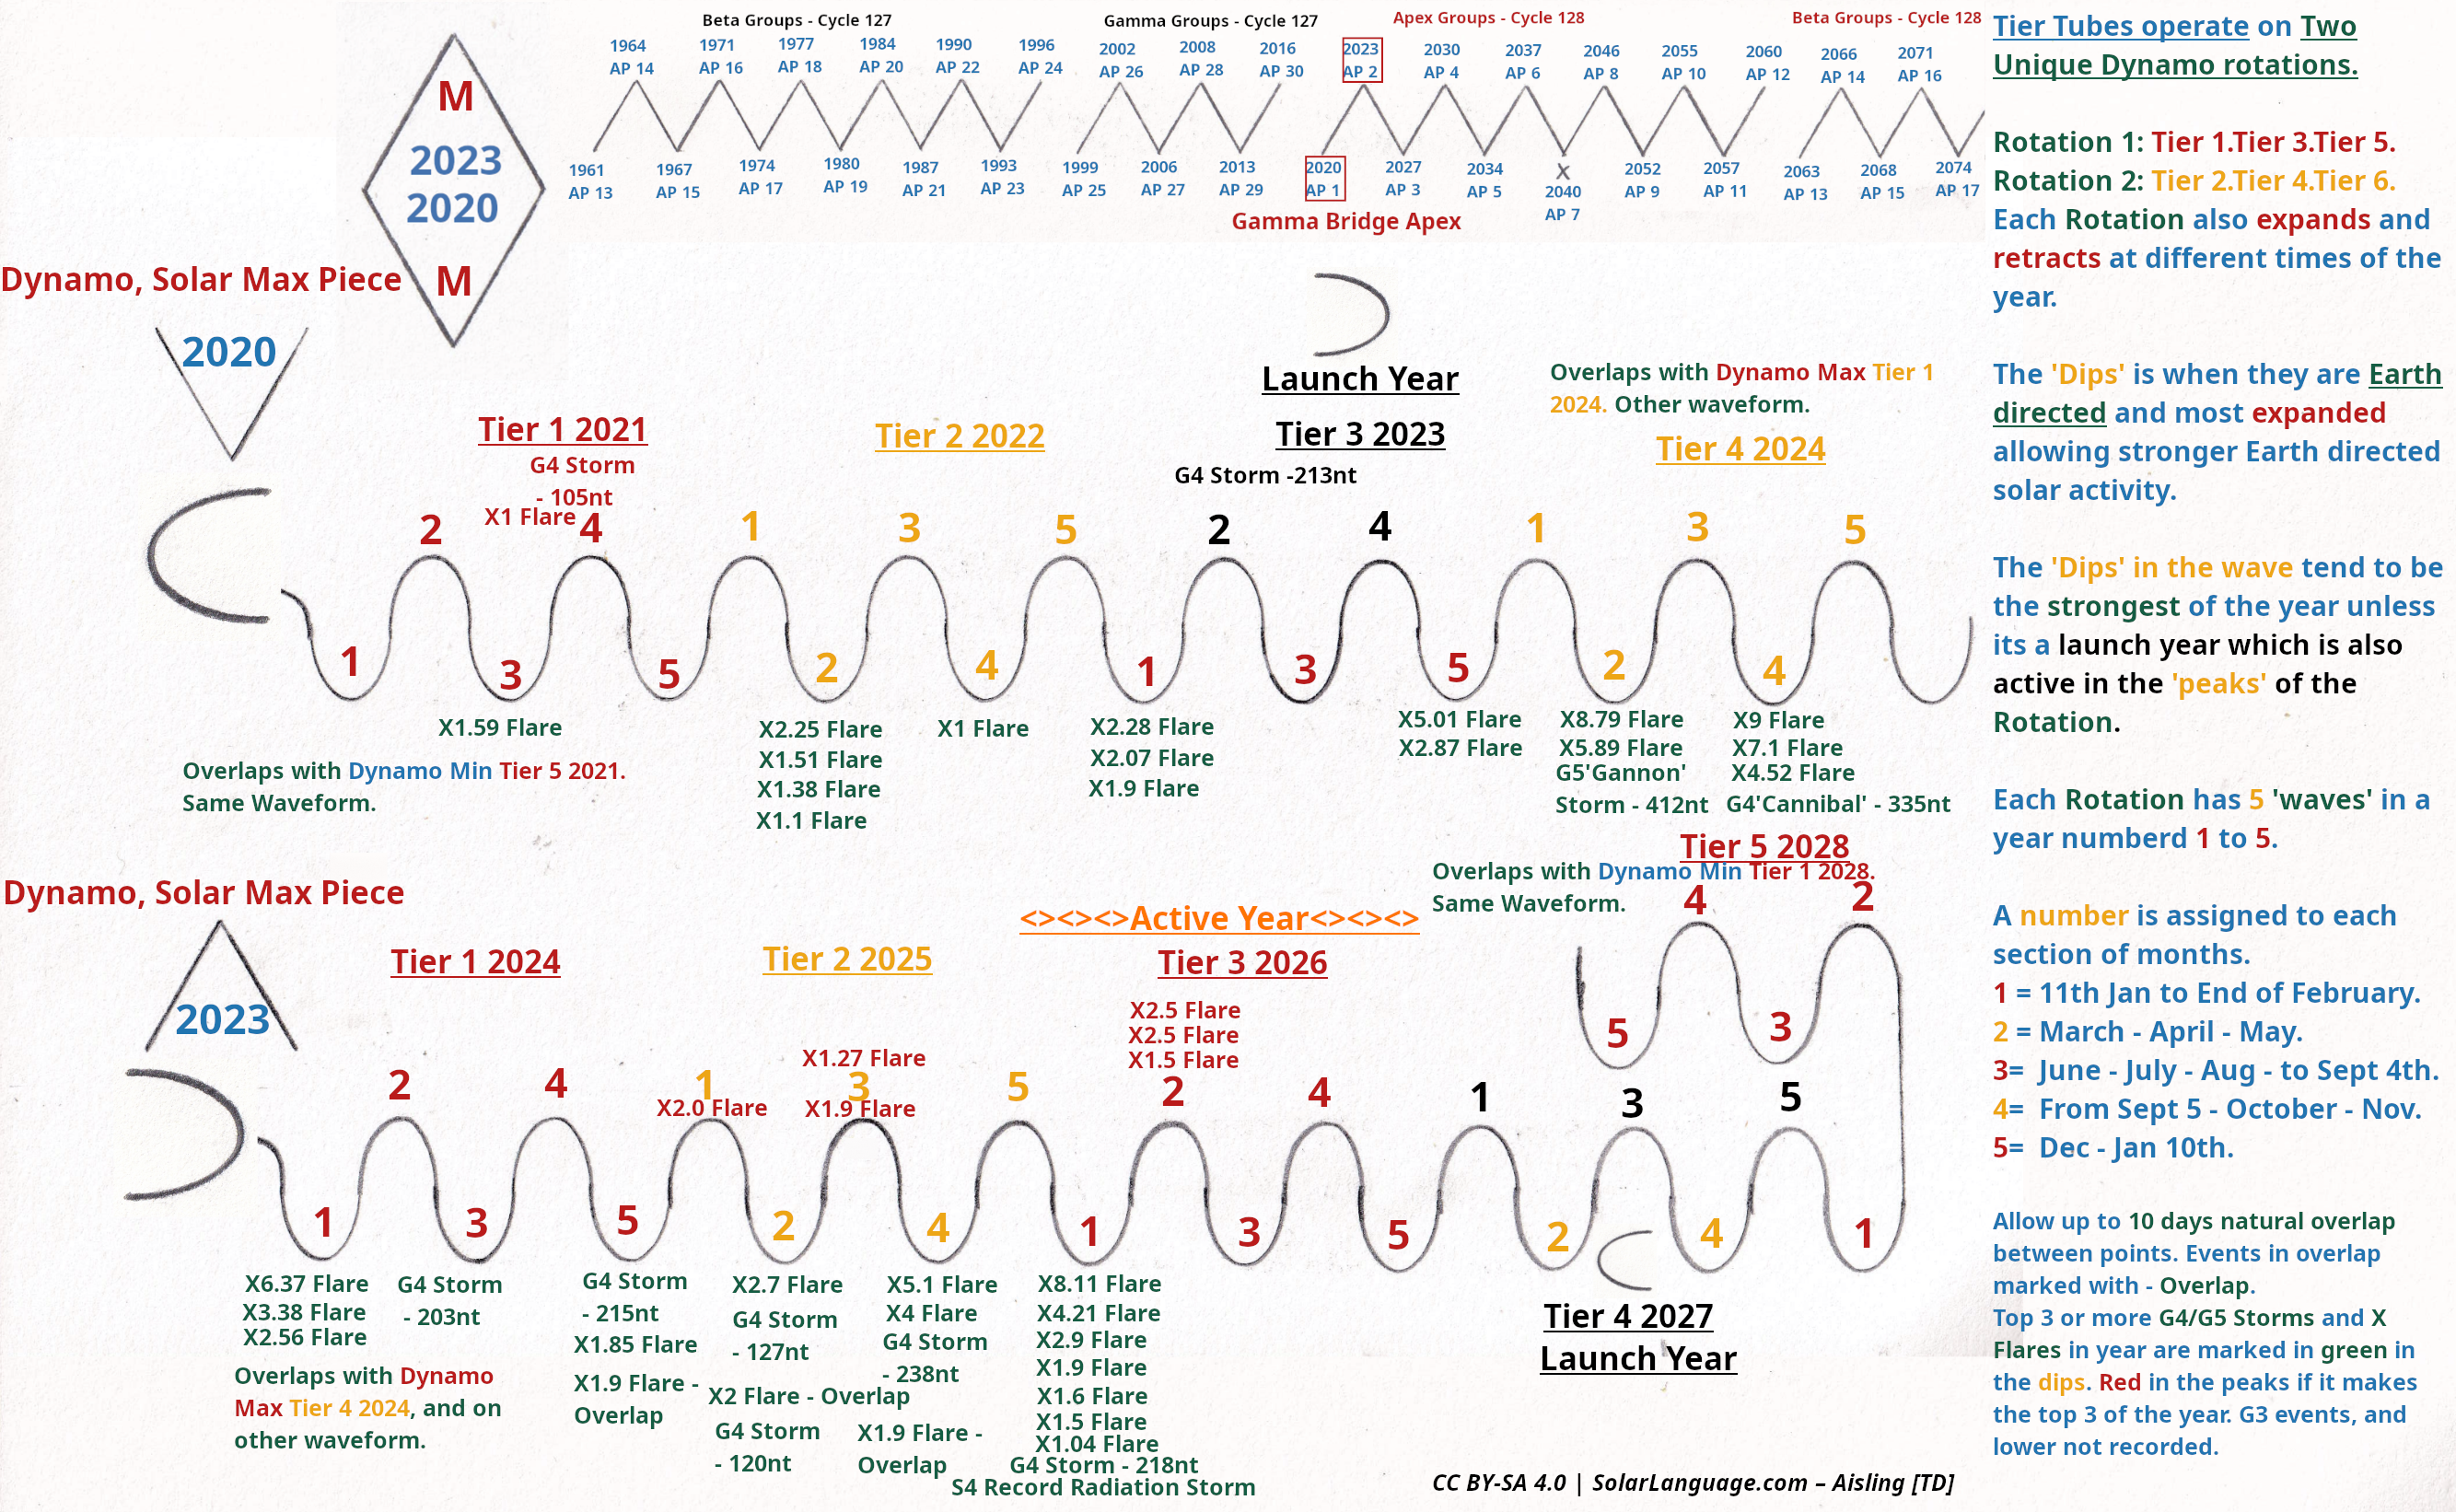
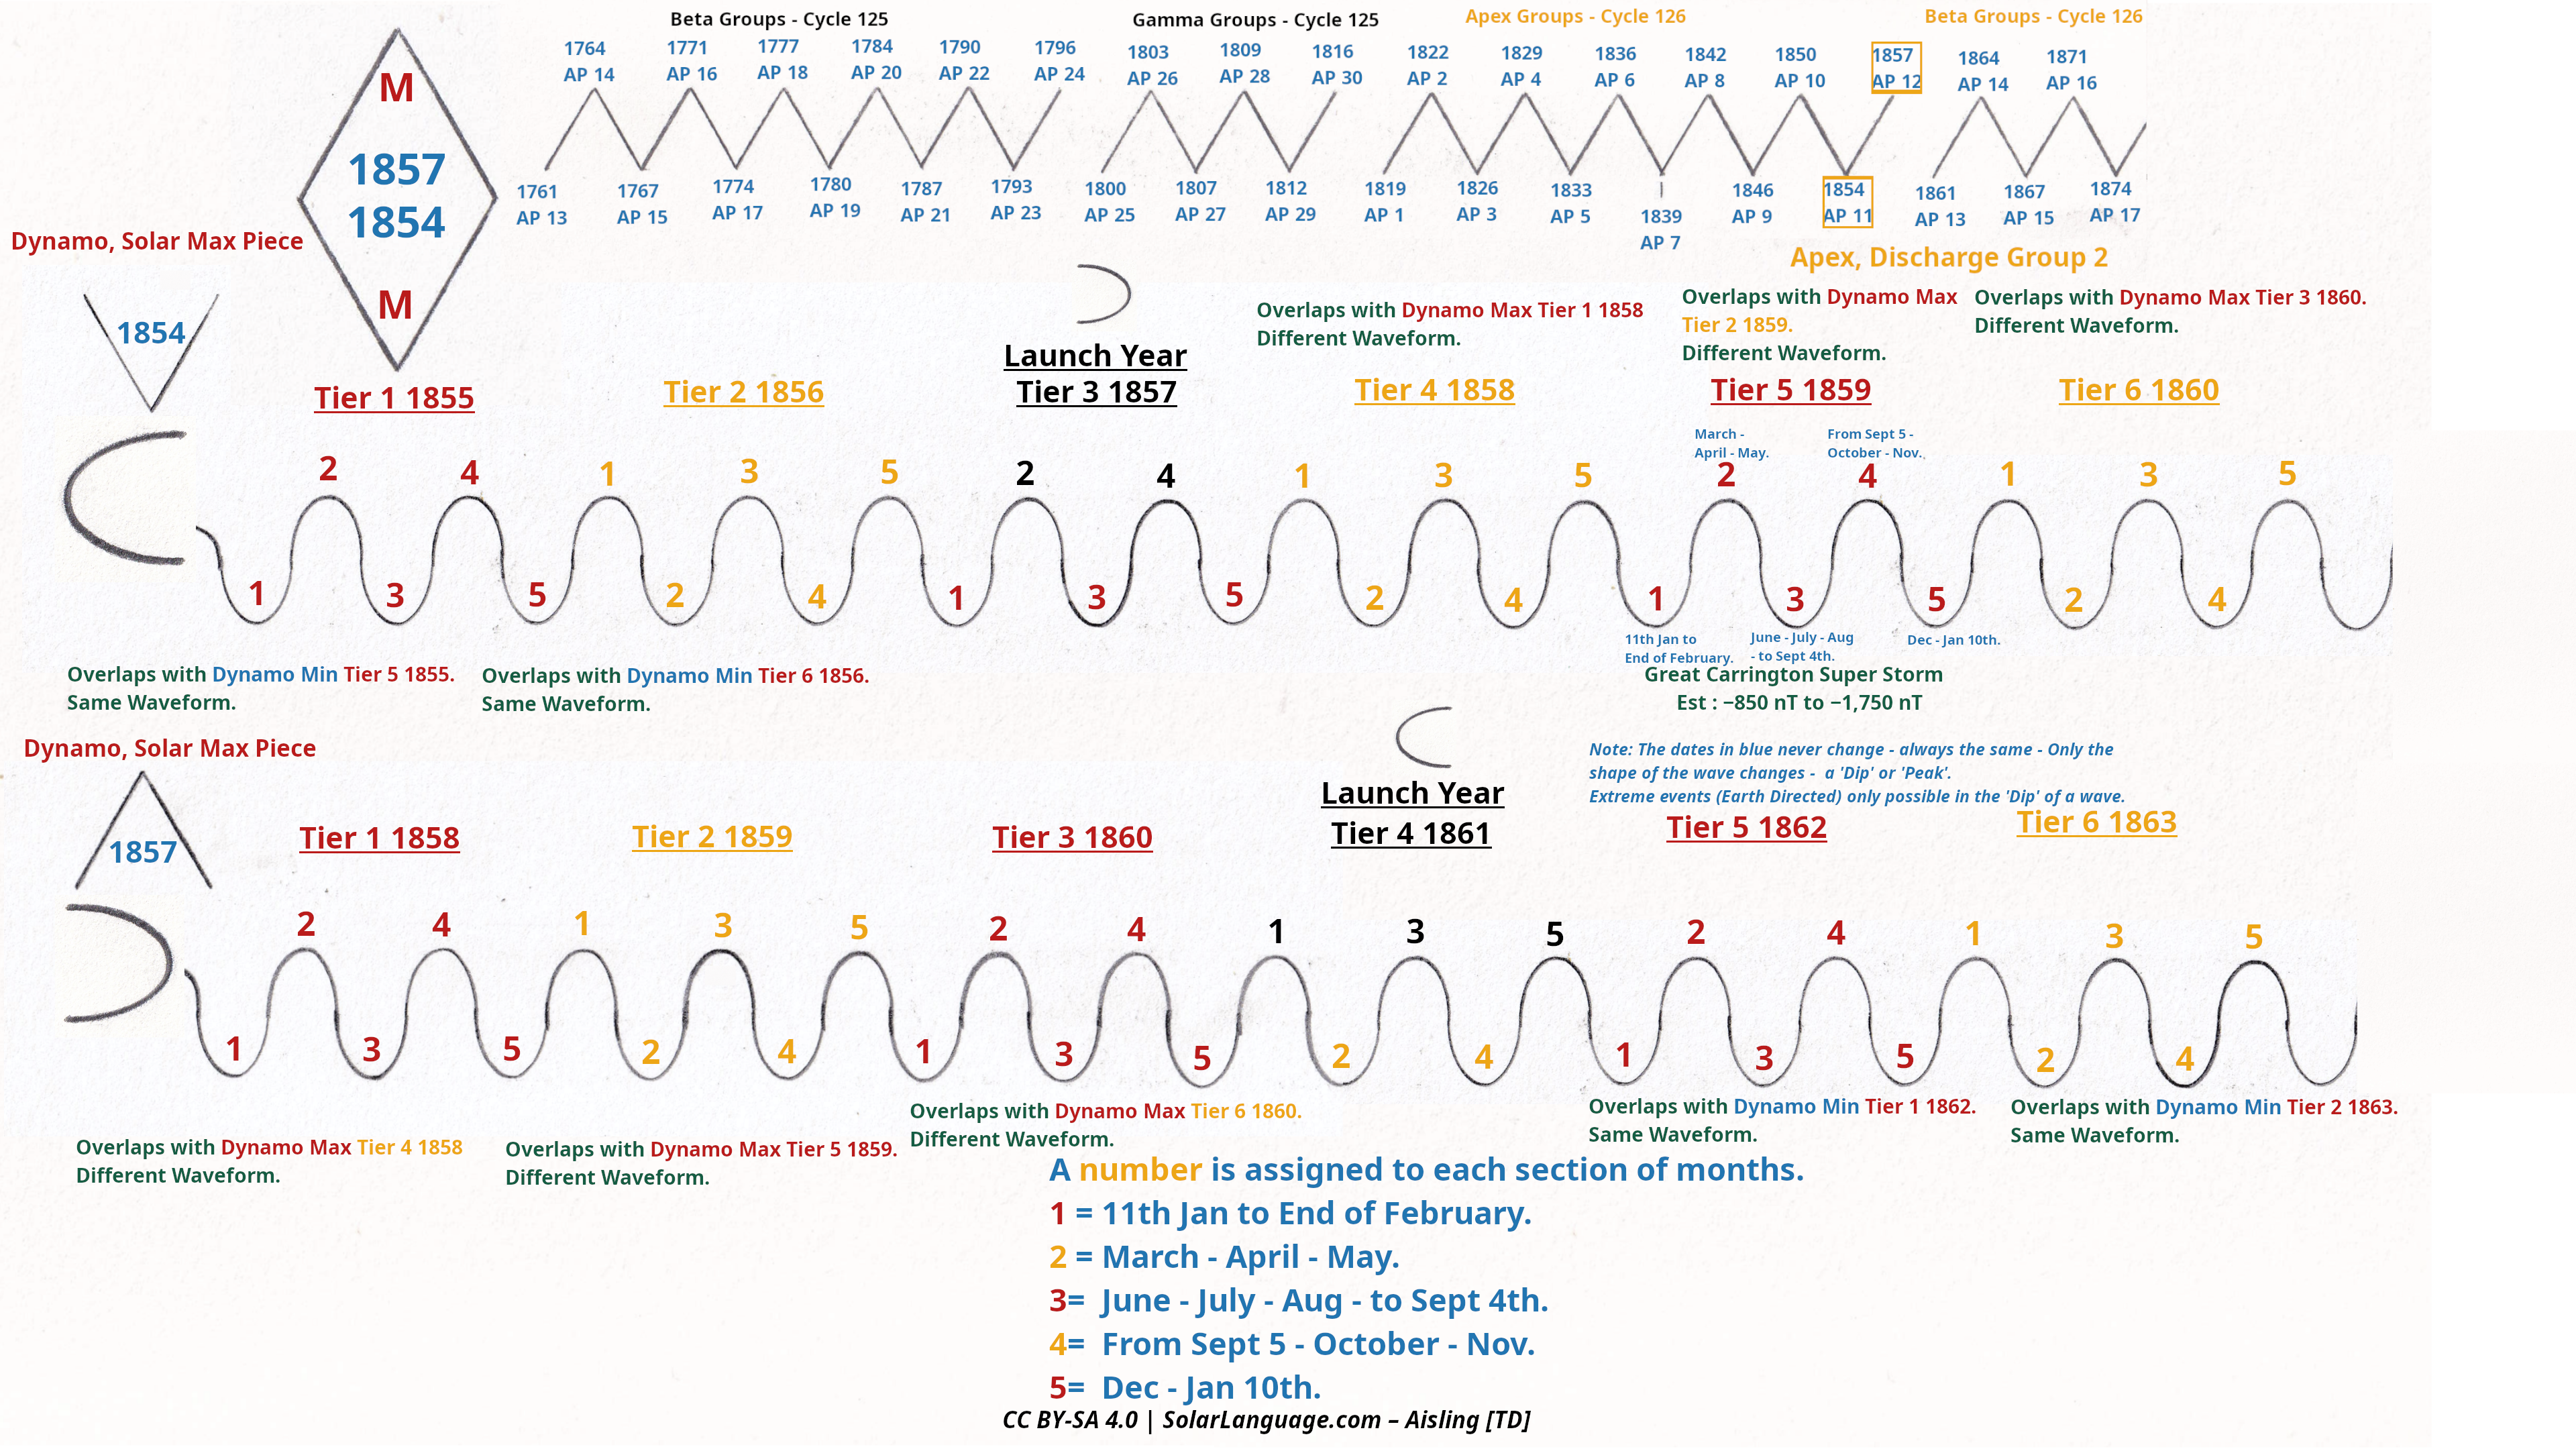
Lets apply this to our current Carrington Storm, and take a look at its flux tubes!
The (Down)Tier 5 as a dominant Tier over the (Up)Tier 2(Both are Dynamo Max) delivered Carrington exactly where it was suppose to in the ‘dip’ ‘
Earth directed extreme events possible’ section of the flux tube.
Carrington 1859
Carrington 1859
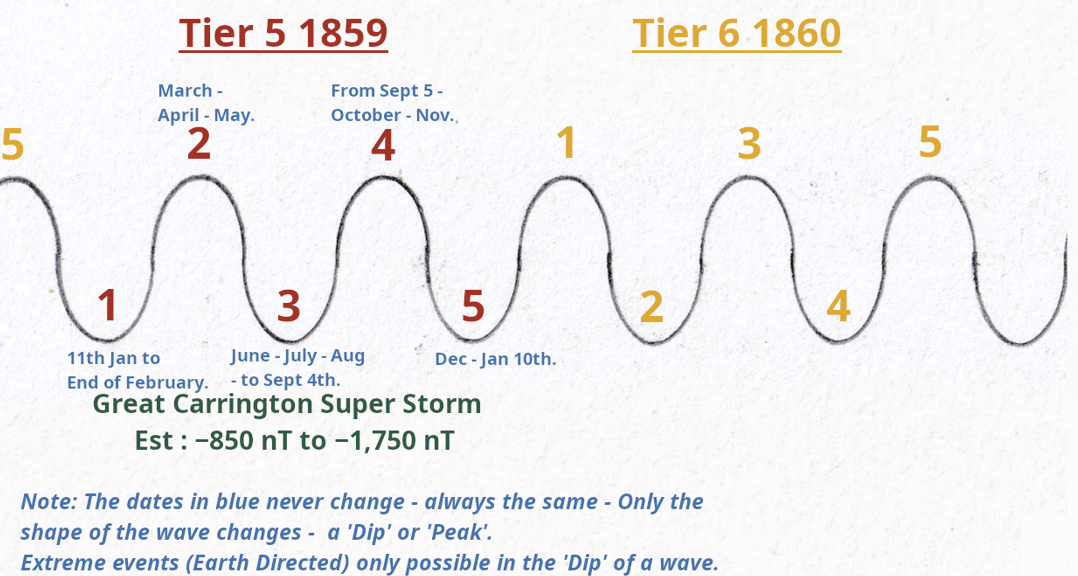
Carrington’s Date is Very Telling
The date tells us a lot too. It happened on the transition point to a lower energy zone.
Transition points can be very turbulent, especially when going from a high energy to a lower energy zone.
If there is a lot of energy built up the zone can rapid fire multiple flare/CME in quick succession, and as this was an Earth directed high energy zone it took many of the hits.
I said earlier flux tubes are forced to change direction 5 times every year. Guess what happens when they are near the surface in a high energy zone? They don’t wear seatbelts!
Going from a low to a high energy zone is less turbulent like this year at the start of June. Few days of minor activity, and over all a low amount of energy released to the Action piece in 2023 for it to play with.
When the zone is long duration like the one we are in now (June to sept 4) It takes time to warm up compared to a shorter one like January 10th to end of February.
This means we should expect an up tick in activity by mid July, and again around end of August at the transition point.
Another example of this exact transition point like 2026 was in sept 2005. (2005 had much more energy behind it, and I would not expect a similar performance this year. It will struggle to match it.)